The Agency Frontier

Executive Summary
In August 2026, two AI systems built for entirely different purposes, by companies on opposite sides of the industry, landed on the exact same number: 96.9% accuracy. One is a closed-model assistant. The other is an autonomous agent that needs no human at all to act. That tie is the finding this report is built around.
This year's fieldwork by WorkN'Play puts the number beyond doubt: Gemini 3.1 Pro, Google's closed-model assistant operating at medium agency, and GenSpark AI, MainFunc's fully autonomous, high-agency multi-agent system, both scored 96.9% accuracy - the single highest result recorded anywhere in this year's 33-entry panel. One of these systems answers a prompt. The other plans, executes, and completes multi-step work with little or no human intervention. Reasoning power, this result shows with unusual clarity, does not scale automatically with autonomy. A platform's place on the agency spectrum tells a buyer what kind of work it is built to do; it does not, on its own, tell them how accurately it will think.
A Panel Built for Contrast, Not Convenience
That finding only carries weight because of what stands behind it: four consecutive years of unbroken monthly testing, and a 2026 panel that has grown to 33 tracked platform entries drawn from 20 named AI systems, spanning every serious position on the market today - from low-agency companionship apps to fully autonomous agents. This diversity is not incidental to the report; it is the point. A study built only on frontier chatbots would tell a narrower, more comfortable story. This one is deliberately wider, and the width is what makes the comparisons that follow meaningful rather than convenient.
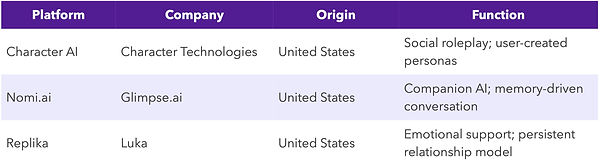
The panel is organised into five categories, each representing a distinct rung on the agency ladder: Conversational AI - Low Agency (Character AI by Character Technologies, Nomi.ai by Glimpse.ai, Replika by Luka - companionship systems with no reasoning or retrieval infrastructure); Hybrid AI Assistants - Frontier / Closed-Model (ChatGPT by OpenAI, Claude by Anthropic, Copilot by Microsoft, Gemini by Google, Grok by xAI); Hybrid AI Assistants - Open-Model Productised (DeepSeek by DeepSeek, ERNIE-Wenxin by Baidu, Kimi by Moonshot AI, Meta AI by Meta, Mistral by Mistral AI, Qwen 3.8-Max by Alibaba); Search-Native AI (Perplexity by Perplexity AI, You.com by You.com); and Agentic AI - High Agency (Genspark AI by MainFunc, MiniMax-M3 by MiniMax Group, SuperNinja Agent by NinjaTech AI, Z.ai Agent (GLM-5.2) by Zhipu AI).
Read by country of origin, the panel doubles as a live map of the global AI competition. Thirteen of the twenty systems are American (OpenAI, Anthropic, Microsoft, Google, xAI, Meta, Perplexity AI, You.com, MainFunc, NinjaTech AI, Character Technologies, Glimpse.ai, and Luka), six are Chinese (DeepSeek, Baidu, Moonshot AI, Alibaba, MiniMax Group, and Zhipu AI), and one is French: Mistral, built by Mistral AI as the panel's standing exception to a US-versus-China contest and, not incidentally, the clearest commercial expression of Europe's push for AI sovereignty. For any organisation reading this report through a competitive-strategy lens, that geographic split is not background colour - it is a direct input into procurement decisions shaped by data residency, export control, and jurisdictional risk.
A Plateau, Not a Collapse
Averaged across all 33 platform entries, the panel's Composite Cognitive Accuracy Rate has climbed from 42.5% in August 2023 to 77.5% by August 2026 - a 35.0 percentage point gain over four years of monthly measurement. Read as a single arc, that is a genuinely large improvement. Read year by year, it is a warning. Annual gains ran 17.9 points from 2023 to 2024, 15.4 points from 2024 to 2025, and just 1.7 points from 2025 to 2026 - roughly a tenth of the previous year's pace. Three years of double-digit progress have been followed by one year of near-flat movement. This is not a collapse; the score still rose. But it is an inflection point, and it changes the calculus for any organisation still waiting for next year's model to fix this year's shortcomings on its own. That assumption no longer holds automatically. For a ministry or a company building a multi-year AI adoption plan, this is, in practical terms, a rare moment of stability: the platforms on the market today are a far better guide to the platforms available in twelve months than at any earlier point in this study, which makes now a sound moment to commit, build workflows, and invest in change management - rather than continuing to defer that investment while waiting for a step-change this year's data gives no reason to expect on a predictable timeline.
Category Tells You What a System Is Built For - Not How Well It Reasons
Breaking the composite score down by category is where the diversity of this panel earns its keep. It shows plainly that accuracy does not scale neatly with agency, and that a platform's category is a starting point for a procurement conversation, never a substitute for testing the shortlisted platform against the actual task at hand.

Agentic AI posts the strongest category average, 91.2%, which fits an intuitive story: newer, more autonomous systems reason best. The next result breaks that story entirely. Search-Native AI, at 53.3%, is the single weakest category in the entire panel - beaten even by low-agency companionship apps at 59.5%, products never designed for analytical work in the first place. The explanation is not that retrieval-grounded systems are poorly built; it is that this battery tests closed-book reasoning, precisely the task where live web retrieval adds little and can introduce noise. The operational lesson is direct: a search-native platform is the wrong tool for closed-book analysis and a strong one for anything that genuinely depends on current information - and for tasks that need both, this year's evidence points to a two-tool workflow rather than expecting either paradigm to do both jobs alone.
Just as important: how much a category's average can be trusted varies sharply. Frontier/Closed-Model assistants show a 43.1-point range between their weakest and strongest entrant - the widest of any category - driven by gaps like Copilot's default "Smart" mode (53.8%) sitting far below its own "Think Deeper" tier (81.5%), and its own stablemate Claude Sonnet 5 (89.2%). An organisation that rolled this platform out at scale on default settings may be getting materially less reliable output than the vendor relationship implies, at no extra cost to change. This is the diversity argument in miniature: the difference between the best and worst platform inside a single category is, in several cases, wider than the difference between category averages - which means platform choice, and even setting choice, routinely matters more than category or brand.
Where the Panel Is Strong, and Where It Is Genuinely Slipping
Disaggregated into its four underlying skills, the panel is strongest on Language Skills (82.3%) and weakest on Numerical Ability (70.2%), with Rational Thinking (77.5%) and Verbal Reasoning (72.4%) in between. Two of these domains, Language Skills and Numerical Ability, have climbed every single year since 2023. The other two have not: Verbal Reasoning fell 4.2 points and Rational Thinking fell 3.6 points this year - the first declines either domain has recorded in this study's four-year history, and they arrive in exactly the two domains most closely tied to judgement-dependent work: eligibility checks, compliance determinations, and first-line diagnostic reasoning. One weaker year is not yet a trend. But it is the first crack in an otherwise unbroken upward record, and it is reason enough to treat 2027's reading as decisive.
Practical Implications for the Working Week
Set aside the strategic map for a moment, and this year's data resolves into a short list of decisions any manager, procurement lead, or IT function can act on this quarter:
-
Test the shortlisted platform, not the category reputation. Category averages span up to 37.8 points; individual platforms within a category span up to 43.1. A platform's tier tells you what it was built for, never how well it will score on the specific task you need it for.
-
Never default to the fastest, cheapest setting without checking. Switching from a speed tier to a depth tier gains 12.7 points on average - but a third of multi-variant platforms show no meaningful benefit from paying the premium at all. Test both tiers of a given platform against the actual task before committing budget or workflow design to either.
-
Match the platform to the skill the task actually needs, not to its composite score. A platform with a mediocre overall result can still be the right choice for a task resting on the one skill it happens to be strong in - and a strong overall performer can quietly fail on the one skill a task depends on.
-
Treat a high agentic-AI score as necessary, not sufficient. Agentic AI leads every skill this report measures, but a strong cognitive core is not proof that an autonomous agent will plan, sequence, and execute a real, consequential workflow correctly. Oversight, audit trails, and rollback capacity remain essential wherever this tier is deployed.
Taken together, these findings describe a technology that is maturing, unevenly, in public view. The composite curve is levelling off just as autonomy is rising - and that combination, not the headline accuracy number, is the fact every organisation deploying AI in 2026 needs to plan around. It is also precisely where this report's conclusion turns next.
Research Methodology
Since its launch in 2023, this study has tracked how artificial intelligence performs against a fixed battery of cognitive tests, administered every month, across four skill clusters: Linguistic Proficiency, Verbal Reasoning, Rational Thinking, and Numerical Ability. The first full year of results was published in 2024, a second annual comparison followed in 2025, and this report presents the fourth consecutive year of fieldwork, drawing on 48 months of monthly data collected without interruption since the study's inception. That four-year span is what turns a set of snapshots into an actual record of technological change: it lets us say with confidence not just how a given platform performs today, but how far, and how consistently, it has come since 2023.
This year's edition also widens materially in scope. Earlier editions concentrated on conversational systems designed primarily to hold a dialogue. The market has since moved well past that starting point, and so has this study: the panel now covers 33 AI assistant platforms spanning three tiers of AI agency, from systems that simply respond to a prompt, through general-purpose assistants that reason, retrieve information, and use tools, to autonomous agents that plan and execute multi-step tasks with little or no human intervention. The same four-cluster, forty-item battery, ten items per cluster, is put to every one of these platforms every month, regardless of where they sit on that spectrum, which is what keeps four years of prior results, and this year's expanded panel, on a single comparable footing.
Panel Composition and Agency Levels
Understanding this year's results requires understanding what is actually being compared, since a low-agency companion app and a high-agency autonomous agent are different kinds of product, built by different kinds of company for different purposes, even though both now sit in the same 33-platform panel. This section sets out how the panel is organised, which company stands behind each platform, why each one belongs in its particular tier, and how that category of platform tends to be put to work in government and industry today, so that a reader can judge for themselves how much weight to place on a comparison between any two entries in the results tables that follow. The organising principle throughout is AI agency: the degree to which a platform plans, retrieves, and executes tasks on its own, rather than simply responding to a single prompt.
Panel 1 - Conversational AI (Low Agency)
Panel 1 sits at the low end of the agency spectrum: three platforms that are reactive and dialogue-oriented by design, built for social and emotional engagement rather than analytical or task-completion work. None of them plan multi-step actions, call external tools, or retrieve live information; each is, at its core, a conversational partner.
.jpg)
Deployment of this tier is concentrated almost entirely in the private consumer market: companionship and wellbeing apps, social roleplay and entertainment products, and retention-focused engagement features bolted onto consumer subscriptions. Direct public-sector use is limited and, where it exists, tends to sit in pilot programmes for citizen wellbeing or digital-companionship services for isolated or elderly populations rather than in core administrative functions. This is also the one tier for which "chatbot" remains the accurate word, a point this report returns to below.
Panel 2 - Hybrid AI Assistants (Medium Agency)
Panel 2 is both the largest tier, twenty-six of the thirty-three platforms, and the most internally varied, so this report splits it into three sub-panels along a single organising principle: who owns the underlying model, and how open that model is to outside inspection, hosting, or fine-tuning. That distinction matters more for benchmarking, and for procurement, than how polished any given product happens to look on screen.
2A - Frontier / Closed-Model Assistants
The eleven platforms in Sub-Panel 2A are built on proprietary models that their own developers keep closed.

What unites this sub-panel is not the brand but the business model: each of these companies has made a large, sustained investment in training infrastructure, wraps its model in heavy alignment and safety layers, presents a polished consumer-product interface, and keeps the underlying weights closed, unavailable for outside deployment, inspection, or independent fine-tuning. These are the platforms most people mean when they picture a mainstream AI assistant today, and in practice they are the ones most often licensed at organisational scale for general-purpose knowledge work: drafting and reviewing correspondence, policy notes, and contracts; summarising reports and case files; supporting software development; and handling first-line customer or citizen enquiries, in both ministries and corporations, usually under a formal enterprise or government licensing agreement that adds contractual data-handling guarantees on top of the base product.
2B - Open-Model Productised Assistants
The twelve platforms in Sub-Panel 2B sit at the opposite end of the ownership spectrum: each is built on a model whose weights are publicly available, meaning an outside developer, including a government's own technical teams, can inspect, host, or fine-tune the underlying model rather than relying entirely on the original developer's own infrastructure.

Every platform in this sub-panel offers a speed tier and a depth, or extended-reasoning, tier, and the gap between the two is itself one of the more interesting findings this report tracks year over year. Meta AI deserves a specific note: it is arguably the most heavily productised platform in this sub-panel, tied into a social graph and a personalisation layer most of its open-weight peers lack, but it is placed here on the more principled ground that its underlying model is open-weight, which matters more for benchmarking than how polished the product wrapped around it happens to be. Because the weights behind this entire sub-panel are open, its platforms are the ones most often chosen where data sovereignty is a genuine concern, an organisation, public or private, that needs to host a model on its own infrastructure, keep data from leaving a given jurisdiction, or fine-tune a model on sensitive internal material without sending it to a third party, will generally look here rather than to Sub-Panel 2A. In practice this makes Panel 2B the natural starting point for sovereign or in-country AI initiatives, and for regulated private-sector deployments, banking, healthcare, defence-adjacent industry, where a closed, externally hosted model is a harder procurement case to make.
2C - Search-Native AI
The three platforms in Sub-Panel 2C occupy their own category because of how they answer a question rather than who owns them: each grounds its responses in live web retrieval rather than relying solely on what its underlying model learned during training.

This is methodologically important enough to flag on its own: a strong score from a search-grounded platform may reflect the quality of its retrieval and ranking as much as the reasoning power of its underlying model, so results from this sub-panel are best read as a direct comparison against each other rather than as a strictly like-for-like comparison against the closed- or open-model assistants elsewhere in Panel 2. In practical use, this is the tier best suited to tasks where the answer has to reflect what is true right now rather than what was true when a model finished training: policy and market research, competitive intelligence, media and news monitoring, and any due-diligence task that depends on current prices, current regulations, or a fast-moving news cycle, in both a ministry's research unit and a corporation's strategy or investor-relations team.
Panel 3 - Agentic AI (High Agency)
The four platforms at the top of the agency spectrum are goal-driven systems built to plan a task, call on external tools, and carry a piece of work through to completion with little or no human intervention at each step.
.jpg)
This is the segment of the panel for which the shift away from "chatbot" matters most: a conversational exchange is, at most, how a person hands one of these platforms an instruction, not a description of what happens afterwards, which may involve multiple tool calls, intermediate planning steps, and autonomous decisions a user never directly sees. Typical use cases are workflow-shaped rather than answer-shaped: processing an application end to end across several internal systems, running a multi-step research task and assembling the resulting report unattended, or handling a customer or citizen case from first contact through to resolution without a human touching every step. Because these systems act rather than merely answer, they represent the newest and least mature segment of this year's panel, the one most likely to show significant movement, in either direction, from one monthly reading to the next, and, in both government and industry, the one that most urgently needs clear oversight, audit, and rollback mechanisms wrapped around it before it is trusted with a consequential task.
Multi-Variant Platforms
Twelve of the 33 platforms, spanning Sub-Panels 2A, 2B, and 2C, in fact offer two or more model variants rather than one: typically a speed-optimised tier for quick, low-latency answers and a depth-optimised, or extended-reasoning, tier for harder problems. Gemini is the only platform with three variants rather than two, reflecting both a speed-versus-depth split and a version upgrade, 3.1 Pro to 3.6, running at the same time. Each variant is tested and scored separately, exactly as if it were its own platform, before being averaged into a single platform-level score; this keeps the speed-versus-depth gap visible as a finding in its own right, while still allowing fair, like-for-like comparison against single-variant platforms elsewhere in the panel.
A Note on Terminology
"Chatbot" accurately described the field this study first measured in 2023, text-in, text-out systems whose only function was to converse, and it still accurately describes Panel 1. It stopped being accurate once Panel 2 platforms began retrieving live information, calling external tools, and reasoning through multi-step problems, and it becomes actively misleading in Panel 3, where a platform's real work happens after the conversational exchange, not during it. This report therefore uses "AI platform" or "AI system" as the general term throughout, and reserves "chatbot" specifically for the low-agency, conversational-only systems in Panel 1, where the word still means what it says.
Value of a Consistent Design
The chief merit of this design is discipline: holding the instrument fixed, across all three panels and regardless of a platform's agency level, means every monthly reading is directly comparable to the one before it, to the same month a year earlier, and, since 2023, to a platform's own starting point four years ago. That consistency underpins meaningful comparisons both across very different platforms at a single point in time, a low-agency companion sitting alongside a high-agency autonomous agent in the same table, and across the evolving versions of a single platform over time. Because the four competency clusters are weighted equally, no single domain can quietly dominate the overall picture, and the resulting composite score reflects a genuinely rounded assessment of each platform's underlying cognitive abilities, independent of how much autonomy it is designed to exercise. Spanning four full years, the study has moved past isolated jumps in capability to reveal sustained patterns of development, or the lack of them, across successive model generations and across the low-, medium-, and high-agency tiers alike, giving a clearer read on the actual pace of technological change than any single year could offer on its own. The fixed ten-item allocation per cluster also keeps the exercise practical to repeat every month across an expanding platform list without diluting its analytical value, and it prevents any one competency area from crowding out the others in the final score.
Acknowledged Constraints
No design of this kind is without trade-offs. Treating four competency clusters as a stand-in for real-world usefulness inevitably simplifies a much richer picture of what intelligence, human or artificial, actually involves, and this premise remains open to legitimate challenge. Running an unchanged item set on a monthly cycle for four years also raises the risk that certain platforms come to perform well on these particular items specifically, rather than on the broader skills the items are meant to represent, a form of overfitting to the instrument rather than genuine growth in underlying ability. Language and reasoning are also inherently sensitive to context in ways that a standardised battery cannot fully capture, and the even ten-item split per cluster, while convenient and easy to administer, may understate how these cognitive skills interact with and depend on one another rather than operating as neatly separable domains. Extending the panel to Agentic AI introduces a further limitation that should be stated plainly: this battery measures underlying cognitive skill through a fixed set of questions and answers, not the planning, tool use, or autonomous multi-step execution that actually define a high-agency platform's day-to-day usefulness, so a strong composite score should never be read as a guarantee of reliable autonomous execution, and a weaker one should not be read as proof that an agent cannot get real work done in practice. Finally, the current instrument says little about the ethical dimensions of AI behaviour, including bias, safety, and fairness, which matter as much to real-world deployment and societal impact as raw cognitive performance, and remain outside the direct scope of this methodology.
Contending with AI Drift
Assessing platform cognition over a period as long as four years brings a further complication: AI drift. This term captures the gradual, often unannounced, shift in a system's outputs and behaviour that can occur even when its name and version number stay the same, driven by changes to training data, fine-tuning routines, or the infrastructure behind deployment. It is a phenomenon our methodology must contend with at every reading rather than treat as a one-off nuisance, and one that plays out differently depending on a platform's position on the agency spectrum: a low-agency companion may drift mainly through changes to its underlying language model, while a high-agency agent can also drift through updates to the tools, orchestration logic, or retrieval pipelines it calls upon, quite apart from any change to the model powering it.
Drift makes it genuinely difficult to draw firm conclusions from a long observation window. A platform that scores well on language and logic tasks in one quarter may look meaningfully different two or three years later, without ever having been formally "re-released." That inconsistency complicates the search for stable benchmarks and undermines confidence in any single trend line, since a dip or a jump in the data could reflect a genuine change in capability, an unannounced adjustment behind the scenes, or simply noise.
Drift is not always visible in the headline numbers. A platform can hold a steady composite score while quietly picking up new biases or reasoning quirks that only surface under closer, more qualitative scrutiny, or, for an agentic system, while a change to the tools it calls on shifts how reliably it completes a task even though its underlying reasoning score has not moved at all.
Its causes are numerous and often intertwined: shifts in the mix of text used for training, tweaks to model architecture or optimisation routines, changes to the tool integrations and orchestration layers that sit around an agent, and even the feedback loops created by how users interact with a system day to day, which can subtly reshape its future responses. Because large language models behave in a highly non-linear way, small internal changes can occasionally produce outsized shifts in what the model actually outputs, making the relationship between a change upstream and its downstream effect on performance hard to predict.
Together, these dynamics make multi-year cognitive assessment a genuinely difficult analytical problem. It calls for evaluation tools that are periodically re-checked, ongoing vigilance for drift between readings, and methods capable of isolating a specific cognitive skill from the noise that drift introduces, so that decision-makers are not left mistaking incidental fluctuation for a genuine trend, or the reverse.
Instruments for Data Collection
The five instruments in each of the four clusters below are administered identically to every platform in the study, from the low-agency conversational systems in Panel 1 to the high-agency autonomous agents in Panel 3. That uniformity isolates the underlying cognitive skills common to all of them, however much autonomy they are built to exercise, and keeps scores comparable across the full 33-platform panel. Because this report is read as much for its operational implications as for its academic ones, each instrument below is described first in terms of what it measures, and then in terms of where that skill actually shows up in day-to-day work, in government and in industry, and what is at stake, in speed, in volume of work done, in the time spent on human oversight and correction, and in the risk of error, when a platform performs well or badly on it.
Linguistic Proficiency Tests
When we set out to probe Linguistic Proficiency, we asked a cluster of practical questions. Can a platform pick up on subtle shades of meaning, tell apart concepts that are easily confused, and interpret language with precision? Is it able to pull out the essential meaning of a passage, spot the main idea buried in supporting detail, and use that understanding to solve problems or reach a decision? Does it recognise words that mean the same thing, and separate those that sound alike but mean something different, all while expressing itself accurately and without wasted words? Can it build sentences that hang together, communicate clearly, tell a story well, argue persuasively, and carry complicated information without losing the reader? And finally, does its vocabulary grow and vary rather than repeat itself, in a way that keeps its writing sharp? These questions guided the design of our Linguistic Proficiency instruments.
Antonym Recognition Test. Here, platforms are given a word and must supply its opposite, a task that puts their grasp of word meaning and semantic contrast on display. It is a direct probe of vocabulary depth and the capacity to spot contrasts in meaning.
This skill sits behind more official work than it might appear to. Government departments and regulated industries alike depend on getting words like "shall" versus "may", or "mandatory" versus "recommended", exactly right in legislation, permits, contracts, and technical standards; a platform that blurs these distinctions when drafting or reviewing such text can quietly change what a document actually commits an organisation to. Strong performance supports faster first-draft turnaround on policy notes, contracts, and technical documentation, cutting the volume of manual redlining a legal or compliance team has to do. Weak performance has the opposite effect: it pushes more of the drafting and review burden back onto specialist staff, slows the document cycle, and, in the worst case, lets an imprecise word choice through into a binding text, with the legal or financial exposure that follows.
Language Comprehension Test. This instrument presents a passage of text followed by comprehension questions, a format familiar from language-proficiency exams and professional certifications alike. It tests the ability to extract meaning from written input under realistic conditions.
Reading and correctly digesting long documents, incident reports, tender submissions, audit findings, is a daily task across both government and industry, and one that consumes a disproportionate share of skilled staff time. A platform that comprehends well can triage inboxes, summarise reports for a briefing pack, or flag the three paragraphs in a hundred-page submission that actually matter, multiplying the volume of material a small team can get through in a day. A platform that comprehends poorly does the reverse: it produces summaries that miss the point, forcing staff to read the source material anyway, so all the usual oversight time is spent with none of the expected time saved, and, if a missed clause slips through unnoticed, the risk shifts from lost time to a genuine misjudgement.
Word Substitution Assessment. Platforms are asked to condense a phrase or a longer description into a single word that preserves its meaning. The task probes vocabulary range, precision of expression, and the ability to compress complex ideas without losing their substance.
This is the skill behind good headlines, case titles, and metadata tags, the small labels that determine whether a document, a support ticket, or a case file is easy or impossible to find again later. In large public administrations and corporations alike, where searchable records are now as much a compliance requirement as a convenience, a platform that reliably compresses meaning into precise labels speeds up classification of high-volume inflows, correspondence, service tickets, procurement files, without a person tagging every item by hand. Poor performance produces vague or misleading tags, which does not show up as an error on the day, but resurfaces months later as time lost searching for a document that technically exists but cannot be found, or as duplicated work because nobody realised a relevant file was already on record.
Syntactic Organisation Assessment. This test asks platforms to reorder a jumble of words into a sentence that is both grammatical and meaningful. It is a useful lens on how well a system has internalised the syntax rules of a language.
Public-facing communications, official correspondence, customer notices, technical manuals, need to read as though a competent professional wrote them, first time, with minimal editing. A platform that constructs sound sentences reliably can draft or clean up this kind of text at volume, cutting the copy-editing workload that otherwise falls to communications teams and freeing staff for substance over phrasing. A platform that struggles here produces text that reads as awkward or unclear, which might seem a minor issue until it appears in a public notice, a safety instruction, or a shareholder communication, where unclear phrasing is not just an aesthetic problem but a source of genuine confusion, complaints, or, in regulated sectors, a compliance finding.
Synonym Recognition Test. Platforms are given a word and asked to supply or select a near-equivalent, revealing the breadth of their vocabulary and their sensitivity to fine shades of meaning. This is a well-established way to gauge vocabulary range and the recognition of semantic overlap.
Any organisation producing large volumes of written material, training manuals, marketing copy, multilingual public information, internal knowledge bases, needs that material to read naturally rather than as a mechanically repetitive draft, and needs its search tools to find a document even when a user's search term is not the exact word used in the text. A platform with strong synonym recognition supports both: it varies its own language convincingly, and it can power search and retrieval systems that find the right document however a person happens to phrase a query, reducing both editorial rework and the time staff spend hunting for information that technically exists somewhere in the system. Weak performance shows up as flat, repetitive drafting that needs a human pass to fix, and as search tools that miss relevant results, a quiet but real productivity drag across large organisations.
Verbal Reasoning Tests
Our Verbal Reasoning instruments grew out of a related set of questions. Can a platform see how different words or objects relate to one another, and sort information into meaningful groups based on shared traits? Is it able to catch a flawed argument, judge whether reasoning holds together, and land on an accurate conclusion? Can it string ideas together in a logical order, communicate them clearly, and hold a reader's or user's attention across a conversation or a piece of writing? Can it put mathematical and statistical thinking to practical use, for instance on questions of cost, output, or efficiency? And can it make sense of spatial descriptions, whether in text or image, including where objects sit relative to one another and to itself? With these questions in mind, we built our Verbal Reasoning tests.
Word Categorisation Test. Platforms are given a list of words and asked to sort them into groups by shared characteristics or theme. The task reveals Verbal Reasoning through a system's capacity to spot abstract connections between words, recognise recurring patterns, and work with nuanced meaning, going well beyond simple vocabulary recall into higher-order thinking that underpins both communication and problem-solving.
This is essentially the skill of sorting a large, messy inbox of unstructured material, customer feedback, complaints, information requests, procurement submissions, into the right categories without a human doing it item by item. A platform that categorises well can process a high volume of incoming correspondence or case files automatically, routing each one to the right team and giving management an accurate, near-real-time picture of what is actually coming in. A platform that categorises poorly creates a different kind of hidden cost: items land in the wrong queue, complaints get treated as routine enquiries or vice versa, and someone eventually has to notice the misfile and manually re-route it, by which point a service deadline may already have been missed.
Deductive Reasoning Test. Platforms are given a set of premises and asked to draw a valid conclusion through logical inference. Doing so well demands close reading and critical interpretation: understanding how pieces of information relate, spotting the underlying pattern, and applying logical rules correctly. Because this leans so heavily on language comprehension and the handling of verbal concepts, it doubles as a strong test of both logical and verbal skill, particularly the capacity to sift relevant detail from noise and to explain one's reasoning clearly.
Few of the tests in this battery map more directly onto high-stakes decision work than this one. Determining whether a case meets the criteria for a benefit, a permit, a tax exemption, or a loan approval is, at its core, an exercise in deductive reasoning: given these rules and these facts, what is the correct outcome? A platform that reasons deductively well can pre-screen large caseloads reliably, letting human case officers focus their time on genuinely borderline decisions rather than routine ones, which materially increases the volume of cases a team can clear. A platform that reasons poorly here is dangerous precisely because its errors look confident: a wrong eligibility determination, wrongly granted or wrongly denied, generates appeals and rework, and, in the public sector, reputational and legal exposure, which is why this is exactly the kind of task organisations are right to keep under close human oversight until performance on this test is consistently strong.
Linguistic Cohesion Test. This test looks at how well a platform reads the connective tissue of language, transition words, pronoun reference, and the logical links that hold a passage together. It measures a system's ability to follow an argument as it develops, infer relationships that are implied rather than stated, and grasp a text's overall shape, offering a window onto analytical thinking, reading comprehension, and sensitivity to linguistic nuance.
This test matters most wherever a platform is asked to produce, or check, a long document rather than a short answer, a policy brief, a due-diligence report, a board paper, an audit report. A platform with strong cohesion can be trusted to draft or summarise a genuinely long document without losing the thread partway through, which is precisely what makes it useful for cutting the drafting time on the kind of substantial reports that otherwise take a skilled analyst days to produce. Weak cohesion shows up as a document that reads sensibly in any given paragraph but contradicts itself, or loses its own argument, over several pages, an error type that is hard to catch on a quick read and can therefore slip past a reviewer, undermining confidence in AI-assisted drafting for exactly the long-form work where the time savings would otherwise be largest.
Quantitative Analysis Test. This test asks platforms to interpret and reason about numerical information embedded in a problem statement. Though it looks quantitative on the surface, it also draws on Verbal Reasoning, since understanding the written problem, isolating what matters, and building a logical solution path are all verbal skills. It differs from a plain Numerical Ability test by demanding more: real-world application of mathematical ideas, interpretation of data, and problem-solving strategy, rather than speed on basic arithmetic.
Budget narratives, business cases, and financial memos routinely mix prose and numbers, a paragraph explaining a decision, with the figures that justify it woven through the text, and getting both right at once is harder than getting either right in isolation. A platform that handles this well can draft or check a budget note, a business case, or a cost-benefit memo where the numbers and the narrative genuinely agree with each other, saving finance and planning staff a meaningful amount of cross-checking time. A platform that handles it poorly produces documents where the prose says one thing and the underlying figures say another, an inconsistency that is easy to miss on a first read and can lead a decision-maker to sign off on a conclusion based on a figure that was never actually correct.
Spatial Awareness Test. We wanted to know whether platforms could engage with spatial questions posed in text or image form, while recognising that any such ability would work quite differently from human spatial cognition, which relies on intuitive processing that language models simply do not have. A platform might interpret a written description of a spatial layout, or read an image depicting one, without truly experiencing space the way a person does. Spatial Awareness is usually treated as a separate category from Verbal Reasoning in cognitive testing, since the latter centres on language-based inference and comprehension. Our hybrid test presents spatial problems through written description, engaging both skill sets at once, though this pairing does not make spatial awareness a verbal skill in its own right.
Infrastructure, logistics, and construction-adjacent work regularly generates written descriptions of physical layouts, a warehouse floor plan described in a tender document, a site description in a planning application, a network diagram summarised in a report, and someone has to be able to read those descriptions accurately before any decision gets made. A platform that handles this well can support an early read of planning submissions, logistics layouts, or facility descriptions, helping non-specialist staff triage which submissions need a full technical review and which do not, saving specialist engineers and planners from having to look at every single case personally. A platform that handles it poorly risks a plausible-sounding but wrong reading of a spatial layout being taken at face value, a genuine safety and cost risk in any sector where the physical world, not just the paperwork, is what ultimately has to work.
Rational Thinking Tests
Can platforms sharpen the way we think and help us solve problems more effectively? Are they able to make sense of complicated situations, trace how events connect, spot recurring patterns, and forecast the likely results of an action? And can they think abstractly and creatively in ways that echo human ingenuity, arriving at solutions no one has tried before? These are the questions behind our Rational Thinking tests.
Analogies Test. An Analogies Test gauges whether a platform can identify the relationship between a pair of concepts and carry that relationship over to a new pairing. Platforms are shown a related pair, then a third term, and asked to complete the analogy. Because it calls for logical reasoning, pattern recognition, and the ability to abstract a relationship and reapply it elsewhere, strong performance points to flexible, abstract thinking. For an AI platform, doing well here suggests advanced language understanding and reasoning, though it should not be mistaken for human-style general intelligence: it mainly shows the system's capacity to manipulate abstract concepts, which matters for natural-language understanding and generation more broadly.
Explaining an unfamiliar regulation, a new technology, or a policy change to a non-specialist audience is very often an exercise in finding the right analogy, the comparison that makes an unfamiliar idea land instantly because it echoes something the audience already understands. A platform that reasons well by analogy is genuinely useful for drafting the plain-language briefings, explainer notes, and public communications that sit between technical experts and decision-makers, work that currently consumes real time from communications and policy staff. A platform that reasons poorly by analogy tends to produce comparisons that are subtly wrong or misleading, which is a quiet risk: a flawed analogy can shape how a decision-maker understands a problem long after the specific words are forgotten, so a bad comparison used in a briefing can do more lasting damage than a bad sentence.
Artificial Language Test. This test presents a platform with an invented language, complete with new words, grammar, and syntax rules that exist nowhere else, and asks it to apply those rules correctly across a range of different situations. Stripping away the familiarity of a real language isolates a system's raw capacity for pattern recognition, rule application, logical reasoning, and cognitive flexibility, since there is no way to fall back on memorised vocabulary or prior exposure. Success suggests fast learning and the ability to generalise rules to unfamiliar contexts, a useful signal of adaptability. That said, performance here is shaped by training data and underlying algorithms as much as by anything resembling genuine language acquisition, and strong results are better read as evidence of sophisticated natural-language processing than of true linguistic creativity, so it is best interpreted alongside other Rational Thinking measures rather than in isolation.
Every organisation that adopts an AI platform has its own internal shorthand, coding schemes, form numbers, product names, department acronyms, and regulatory clause references that no general-purpose model has ever seen before deployment. This test is, in effect, a proxy for how quickly a platform can pick up an organisation's own rules and conventions once it is put to work. Strong performance means shorter, cheaper onboarding: less fine-tuning, fewer configuration cycles, and fewer early mistakes while staff are still teaching the system the local vocabulary. Weak performance means the opposite, a longer bedding-in period during which outputs need heavier checking, and a higher ongoing maintenance cost every time an internal process or naming convention changes and the platform has to relearn it.
Cause & Effect Test. Here, platforms are shown a scenario and asked to identify the most plausible cause or the most likely consequence of what is described. The test measures the ability to work through a complex situation, separate correlation from causation, and apply logical reasoning to a real-world case, including weighing multiple factors at once, ruling out weak or implausible explanations, and reaching a conclusion that is grounded in the evidence rather than in surface pattern-matching. Strong performance suggests a system can process context, draw sound inferences, and mimic human-style reasoning, though, as with the other Rational Thinking tests, this is best treated as evidence of sophisticated language processing rather than proof of genuine understanding or consciousness. Its practical value lies in what it reveals about a platform's ability to give coherent, contextually sound answers, useful for decision support, troubleshooting, and generating plausible explanations for real phenomena that a user might bring to it.
This is close to the core skill required for any diagnostic function, an IT help desk working out why a system went down, an inspector working out why a piece of equipment failed, a fraud team working out why a transaction pattern looks wrong. A platform that reasons well about cause and effect can act as a credible first line of triage, narrowing a wide field of possible explanations down to the two or three worth a specialist's time, which directly increases the volume of incidents a technical or investigative team can get through. A platform that reasons poorly sends investigators down false leads, wasting exactly the specialist hours the tool was meant to save, and in a safety-, fraud-, or security-critical setting, a wrong causal read is not merely inefficient, it can mean the real problem goes unaddressed while attention is spent elsewhere.
Logical Problems Test. This test presents puzzles or scenarios that call for systematic analysis, pattern recognition, inference, and sound conclusions drawn from a defined set of given premises. Working through a chain of logical steps exercises deductive and inductive reasoning, the ability to spot logical fallacies, and sound judgement under the constraints of the evidence provided, without room to fill gaps with outside assumptions. A strong result indicates that a system can process information methodically, follow logical rules faithfully, and reach rational conclusions on the basis of what it has been given, though this reflects sophisticated pattern-matching and programming rather than human-equivalent understanding. Its relevance lies in demonstrating a system's readiness for tasks that hinge on careful logical analysis and structured decision-making, which are relevant to a wide range of practical applications.
Rule-bound administrative decisions, scoring a tender against fixed criteria, checking a form against a compliance checklist, allocating a resource according to a published policy, are everywhere in both government and large organisations, and they are exactly the kind of task where a platform's logical reliability translates directly into staff time saved. Strong performance here supports genuine, safe automation of first-pass decisions at volume, freeing skilled staff for the judgement calls that machines should not be making alone. Weak performance is costly in a specific way: because the errors are rule-application errors rather than obviously wrong answers, they often look plausible enough to pass a quick check, which means every output has to be independently re-verified by a compliance officer or case worker, quietly erasing the time saving the automation was supposed to deliver in the first place.
Number Series Test. Platforms are shown a sequence of numbers and asked to identify the pattern governing it and predict the next value. The task exercises pattern recognition, logical reasoning, and mathematical aptitude, requiring a system to work out the numerical relationship at play and apply it systematically. A good result signals strong numerical analysis and pattern-spotting, but this is more likely a reflection of fast processing shaped by training data than of any deeper mathematical understanding, so it works best as one component within a broader battery of analytical tests rather than a standalone measure.
Spotting a trend, a demand curve turning upward faster than expected, a budget line quietly drifting off track, a spike in network traffic that does not fit the usual pattern, is a routine part of running a public service, a utility, or a business, and it is often first noticed by a human staring at a spreadsheet or a dashboard. A platform that is good at this kind of pattern extrapolation can flag emerging trends early and continuously, across far more data series than any team could watch manually, which turns monitoring from an occasional manual exercise into an ongoing automated one. A platform that is weak at it produces forecasts that look reasonable but are quietly wrong, a genuine planning risk: budgets, staffing levels, or infrastructure capacity get set against a trend line that never actually happens, and the gap only becomes obvious once it is expensive to fix.
Numerical Ability Tests
How capable are platforms when faced with multi-step problems that blend arithmetic, spatial reasoning, and data analysis? Do they correctly follow the standard order of operations? Can they simplify and solve equations involving fractions with precision? Are they able to handle engineering or financial calculations? How well do they reason about the position, distance, and movement of objects in two and three dimensions, and can they carry that reasoning into physics, engineering, or navigation problems? Can they read a dataset, spot a trend, and reach a probability-based conclusion, applying statistical thinking to real situations? And can they walk through their working step by step, showing their reasoning as they go? These questions shaped our Numerical Ability tests.
Temporal Mathematics Evaluation. This test covers age-related calculations and other forms of time-based arithmetic, from working out how old someone will be at a future date to reasoning through problems that combine several time intervals. It sits within basic arithmetic and logical reasoning, territory that most current AI systems handle comfortably, so results here mainly speak to a platform's ability to manipulate numbers, grasp time-related concepts, and execute elementary mathematical steps correctly, rather than to any particularly advanced numerical skill.
A surprising amount of public administration runs on age- and date-based eligibility: pension age, benefit thresholds, licence renewal windows, statutory notice periods. These calculations look trivial individually but are done at enormous volume, and an error rate that would be negligible on a handful of cases becomes a real administrative and financial problem multiplied across a national caseload. A platform that gets this consistently right supports safe, low-oversight automation of a genuinely large volume of routine eligibility work, freeing case officers for exceptions and appeals. A platform that gets it wrong, even occasionally, creates wrongful payments, wrongful denials, and the appeals and audits that follow, precisely the kind of error that is expensive not because any single instance is large, but because it repeats at scale before anyone notices the pattern.
Order & Fraction Mathematics Test. This test carries particular weight in evaluating Numerical Ability. It shows whether a platform can apply basic mathematical rules consistently, a foundation for more advanced numerical reasoning, and whether it can work confidently with abstract mathematical notation. Because the problems demand exact answers, the test is a direct check on computational accuracy, and the ability to break a complex expression into steps points to genuine, structured problem-solving rather than guesswork.
This is the arithmetic that underpins invoicing, tax computation, procurement cost breakdowns, and engineering specifications, work where there genuinely is only one correct answer, and every subsequent calculation that builds on it inherits any mistake made early on. A platform that is reliably accurate here can be trusted to handle calculation-heavy back-office work, billing runs, tax preparation, cost estimation, at real volume with a lighter audit burden than a human-only process would require. A platform that is not reliably accurate is, in practical terms, worse than no automation at all in this specific area: every output still has to be independently recalculated to be trusted, so the organisation pays for both the automation and the verification, with none of the promised time saving, and a single undetected error can compound silently through every downstream figure that depended on it.
Spatial Reasoning Test. This test might, for example, ask a platform to calculate distances and angles between objects, or to solve a physics problem involving motion and force vectors. It bears on Numerical Ability, but the two are not identical: spatial reasoning draws on arithmetic but goes further, requiring a broader grasp of how objects relate to one another in space, rather than just the ability to compute a correct figure. Strong performance shows not just computational skill but the capacity to apply mathematical ideas to real, multidimensional problems, which is a distinct and somewhat more demanding form of numerical competence.
Engineering feasibility checks, infrastructure cost estimates, and network or logistics planning all depend on getting distances, angles, loads, and routes right, and an early, rough pass at these numbers is often what determines whether a project proposal even reaches a full technical review. A platform that handles this well can support that early screening stage, filtering out proposals with an obvious technical or physical problem before they reach a scarce specialist engineer, which increases the volume of proposals a technical team can realistically assess in a given period. A platform that handles it poorly is a genuine risk precisely because a wrong technical answer can sound just as confident as a right one, and taking a flawed feasibility read at face value, in construction, telecoms, or transport, is the kind of error that surfaces expensively, later, and on site rather than on paper.
Statistical Reasoning Test. This test asks platforms to work with datasets: interpreting statistical measures, drawing inferences, and reaching conclusions grounded in probability rather than certainty. Beyond producing the right number, a platform is expected to explain its reasoning, discuss what the statistical findings actually imply in context, and flag any limitations, gaps, or potential bias in the underlying data, since a correct figure delivered without that surrounding judgement tells us less about genuine statistical reasoning.
Public-health reporting, economic forecasting, market research, and quality-assurance sampling all depend on someone reading a dataset correctly and stating honestly what it does and does not support, and this is arguably the highest-stakes test in the whole battery precisely because a wrong statistic, once repeated up a chain of briefings, tends to travel a long way before anyone checks the original source. A platform that reasons well statistically, including being honest about the limits of its own data, earns the kind of trust that lets analysts rely on its first draft of a statistical summary rather than re-deriving every figure independently, a genuine time saving in any data-heavy function. A platform that reasons poorly, especially one that states an unqualified conclusion from a shaky dataset with full confidence, is a serious risk in this context: an overconfident wrong statistic can end up shaping a public statement, an investment decision, or a policy position before anyone traces it back to its source.
Time-Related Calculations. This test covers arithmetic involving time units, dates, durations, and time zones, testing a platform's grip on calendar systems and different ways of representing time. It matters for Numerical Ability because it draws on several skills at once: basic arithmetic, plus an understanding of non-decimal units, such as 60 seconds to a minute or 24 hours to a day, among other quirks of how time is measured. Doing this well points to a platform's ability to apply mathematical concepts flexibly, convert between units, and juggle several variables simultaneously, a strong signal for how it will handle the time-sensitive, practical numerical questions people are likely to bring to it in daily life and at work.
Any organisation that operates across time zones, and that now includes most public administrations coordinating with international partners and most companies of any size, runs into this arithmetic daily: scheduling a meeting across time zones, calculating a service-level deadline, working out whether a contractual notice period has actually expired. A platform that handles this reliably removes a small but constant source of friction and error from cross-border coordination, scheduling, and compliance tracking, freeing administrative time currently spent double-checking dates by hand. A platform that gets it wrong produces a specific, recurring kind of failure: a missed meeting, a breached service-level agreement, a deadline calculated in the wrong time zone, each individually minor, but collectively a real and entirely avoidable cost once an organisation is coordinating at any scale across borders.
Measuring AI Systems' Overall Performance
Composite Cognitive Accuracy Rate
Collective performance across the panel continues to improve in 2026, but the shape of that improvement has changed, and the change itself is the headline finding of this year's results. The Composite Cognitive Accuracy Rate, which combines language-based skills, Linguistic Proficiency and Verbal Reasoning, with more analytical capabilities, Rational Thinking and Numerical Ability, across all 33 platforms in the panel, has progressed from 42.5% in August 2023 to 77.5% by August 2026, an overall gain of 35.0 percentage points over four years of monthly measurement. Read as a single four-year arc, that is still a genuinely large improvement. Read year by year, it tells a different and more interesting story.
The annual gains have been 17.9 percentage points from 2023 to 2024, 15.4 percentage points from 2024 to 2025, and just 1.7 percentage points from 2025 to 2026. In other words, this year's improvement is roughly a tenth of last year's, a deceleration too sharp to be noise. Three consecutive years of double-digit annual gains have been followed by a single year of near-flat movement. This is not a plateau in the strict sense, the composite score did rise, not fall or stall outright, but it is unmistakably an inflection point: the phase of rapid, broad-based improvement that characterised the first three years of this study appears to be giving way to a phase of incremental, harder-won progress.
What the Plateau Means in Practice
A deceleration of this kind is exactly what a maturing technology looks like from the outside. The first few years of any capability curve tend to capture the largest and easiest gains, fixing the most obvious weaknesses, closing the widest gaps, absorbing the lowest-hanging improvements in training data, architecture, and fine-tuning. What tends to remain afterwards is harder: the genuinely difficult residual errors that do not yield to another round of the same techniques. Whether 2026 marks a temporary pause before a further leap, or the leading edge of a longer levelling-off, cannot be answered from a single year of slower growth, and this report does not claim to know which. What can be said with more confidence is that the working assumption behind many current adoption plans, that next year's model will simply be markedly more capable than this year's, no longer holds automatically and should not be relied upon without evidence.
For anyone planning a multi-year AI adoption programme, in a ministry or in a company, this has a direct and useful implication: the case for waiting another year in the hope that the technology will resolve today's shortcomings on its own is now considerably weaker than it was in 2024 or 2025. If the composite curve is genuinely levelling off, the platforms available today are a much better guide to the platforms available in twelve months than they were at any earlier point in this study, which makes this a more sound moment than usual to commit to a platform, build workflows around it, and invest in the integration and change-management work that actually determines whether an AI deployment succeeds, rather than continuing to defer that investment in anticipation of a step-change that may not arrive on schedule. That said, this conclusion applies to the panel in aggregate. As the following sections show, the aggregate figure conceals very substantial differences between categories of platform, and platform choice within a category still matters a great deal more than the flattening top-line number might suggest.
Performance by Category
Averaging across all 33 platforms flattens a genuinely wide spread. Breaking the composite score down by panel and sub-panel shows that 2026 performance is not evenly distributed by category, and, more importantly, that it does not scale neatly with agency level the way a simple story of technological progress might suggest.
Agentic AI, the highest-agency tier and the newest addition to this panel, posts the strongest average accuracy of any category at 91.2%, ahead of the closed-model frontier assistants at 82.8% and the open-model productised assistants at 78.7%. That much fits an intuitive narrative: more capable, more autonomous systems, built more recently, score better. The next two results do not fit that narrative at all. Low-agency Conversational AI, companionship and roleplay products with no reasoning or retrieval infrastructure behind them, scores 59.5%, comfortably ahead of Search-Native AI at 53.3%, the single lowest-scoring category in the entire panel. A category built around live web retrieval, arguably the most information-rich paradigm in the study, performs worse on this cognitive battery than a category of low-agency companion apps never designed for analytical work in the first place.
The five category averages themselves span a 37.8 percentage point range, from 53.3% to 91.2%, with a standard deviation of 16.0 percentage points. That figure describes how differently the categories behave from one another; it says nothing yet about how consistent any single category is internally, a separate question this report turns to shortly, once each category's own platforms have been examined in turn.
This is worth sitting with, because it cuts against the assumption that a platform's category or its marketing positioning is a reliable guide to how it will perform on a reasoning-heavy task. The explanation is not that search-grounded systems are poorly engineered; it is that this instrument tests linguistic, verbal, rational, and numerical reasoning largely in a closed-book format, precisely the kind of task where the ability to retrieve a live web page adds little and may even introduce noise, extra context to weigh, sources to reconcile, retrieval latency to manage, that a purely parametric model does not have to contend with. The practical takeaway is not that search-native platforms are bad tools; it is that they are the wrong tool for closed-book reasoning tasks and a strong one for tasks that genuinely depend on current information, and that a platform's category tells a buyer what a system is built to do, not how well it will score on a task it was never built for. Category-level averages are a starting point for a procurement conversation, not a substitute for testing a shortlisted platform against the actual task at hand.
Conversational AI - Low Agency

The three companionship platforms remain, as expected, the weakest cluster on a battery they were never designed to be strong on. What is notable is the internal spread: Character AI, at 41.5%, is the single lowest-scoring platform in the entire 33-platform panel, while Nomi, at 73.8%, comes within a few points of several general-purpose assistants elsewhere in the panel and in fact outperforms the weakest entrant in the frontier closed-model tier discussed below. Across just three platforms, that produces a 32.3 percentage point range and a 16.5 percentage point standard deviation, the highest standard deviation of any category in this year's panel, though with only three data points this figure should be read as indicative rather than statistically robust; a single platform's result carries unusually heavy weight in a category this small. A low score here is not, by itself, a criticism of these products; a companionship app that scores poorly on numerical reasoning is not failing at its actual job. It does mean that none of these three should be considered, procured, or piloted for any task that requires reliable reasoning, drafting, or calculation, low agency and low cognitive accuracy travel together here, and organisations evaluating this category should do so purely on companionship and engagement merits, not on any assumption of general-purpose usefulness.
Hybrid AI Assistants - Frontier / Closed-Model

This is the widest-ranging sub-panel in the study, spanning 43.1 percentage points from the weakest to the strongest entrant, the single widest range of any category in the panel, and the range carries a genuinely practical warning. Copilot (Smart), the fast, default-mode variant of one of the most widely deployed enterprise assistants in both government and corporate environments, scores 53.8%, below the average of the low-agency Conversational AI category and barely half the accuracy of its own Think Deeper variant at 81.5%. An organisation that has rolled out this platform at scale and left staff on the default fast mode may be getting materially less reliable output than the vendor relationship implies, at no extra cost to switch, since the fixed effort of prompting a deeper mode is trivial next to the accuracy gap it closes. ChatGPT shows a similar pattern in miniature, 61.5% on the free tier against 93.8% on ChatGPT Plus, a 32.3 percentage point jump that represents the single largest speed-to-depth gap of any platform pair in this year's results. At the other end of this sub-panel, Gemini 3.1 (Pro), technically the prior-generation variant retained alongside the newer 3.6 line, edges out its own newer sibling, 96.9% against Gemini 3.6 (Deep Think)'s 95.4%, and ties Genspark AI for the single highest score in the entire panel. That a legacy variant can still out-perform its intended successor is a useful reminder that version number is not a reliable proxy for accuracy either, inside a single vendor's own product line as much as across the panel at large. Despite this wide 43.1 point range, the standard deviation across the eleven platforms is 14.3 percentage points, noticeably lower than the range alone would suggest; the detail matters, and this report returns to it in the consistency comparison below.
Hybrid AI Assistants - Open-Model Productised

The open-weight tier is broadly strong, five of twelve entries score above 90%, but it is also where the clearest anomalies in this year's data appear. Meta AI's Instant and Thinking variants both score exactly 93.8% at the composite level; the skill-by-skill breakdown developed later in this report shows that tie is not an absence of movement but two offsetting shifts, a real gain on Verbal Reasoning against a broadly matching loss on Rational Thinking, so the flat composite score understates the effect of the deeper mode rather than confirming its absence. ERNIE-Wenxin 5.1's Think Deeper variant, by contrast, actually scores lower than its own standard mode, 66.2% against 69.2%, one of only two platforms in the entire panel where the depth tier underperforms the speed tier. Against that, Qwen 3.8-Max shows the opposite pattern in its most extreme form: a 29.2 percentage point jump from its Fast variant, 64.6%, to its Thinking variant, 93.8%, the second-largest speed-to-depth gap in the panel after ChatGPT. Across the twelve entries in this sub-panel, the range runs to 32.3 percentage points with a standard deviation of 13.2 percentage points, a similar overall spread to the Conversational category despite spanning four times as many platforms, which makes it a more statistically dependable reading of genuine dispersion rather than an artefact of a small sample. The practical implication is the same one raised in the frontier tier, but sharper here because open-weight platforms are also the ones most likely to be self-hosted and fine-tuned by an adopting organisation: which variant, and which fine-tuning configuration, is doing the actual work matters enormously, and an organisation building on an open-weight backbone should benchmark its own deployed configuration against this battery, or an equivalent internal one, rather than assuming the headline capability of the base model transfers automatically to however it ends up configured in production.
Search-Native AI

This is the most internally consistent sub-panel in the study, a range of just 3.1 percentage points and a standard deviation of 1.8 percentage points between its weakest and strongest entrant, but consistency here means consistently weak: no platform in this category clears 56%, and You.com's Express and Advanced variants score identically at 52.3%, again showing no measurable benefit from the deeper tier. Combined with the category-level finding above, the practical reading is straightforward. These three platforms should not be selected, or benchmarked, on the promise of general reasoning strength; they should be selected for tasks where grounding in live, current information is the primary requirement and reasoning over that information is comparatively light, market-price checks, breaking-news monitoring, competitive-intelligence scans, and similar retrieval-first tasks. For any task combining a genuine reasoning demand with a need for current information, this year's data points toward a two-tool workflow, using a search-native platform to gather current material and a frontier or open-model assistant to reason over it, rather than expecting either paradigm alone to do both jobs well.
Agentic AI - High Agency

The newest and smallest tier in the panel is also, on this measure, the strongest and the second most internally consistent, an 18.5 percentage point range and an 8.6 percentage point standard deviation against a category average of 91.2%. Even MiniMax-M3, the weakest of the four entrants at 78.5%, outperforms every single platform in both the Search-Native and Conversational AI categories, including the strongest entrants in each. That is a striking result for the least mature category in the study, and it is worth restating a caution raised in this report's methodology: a strong score here reflects the strength of the reasoning engine behind each agent, not a direct measurement of how reliably that agent plans, sequences, and executes a real multi-step task with tools in a live environment, since that is not what this battery tests. A strong cognitive core is a necessary condition for a trustworthy autonomous agent; it is not, on its own, sufficient evidence that the agent will execute a consequential workflow correctly and safely, which is precisely why this category, more than any other in the panel, still warrants the oversight, audit trail, and rollback capacity this report has flagged elsewhere before it is handed a task with real financial, legal, or safety consequences.
Consistency Within Each Category
Accuracy alone answers how well a category performs on average; dispersion, captured here by range and standard deviation, answers a different and equally practical question: how much does it matter which specific platform within that category is actually chosen? Search-Native AI is the most internally consistent category in the panel by a wide margin, a standard deviation of just 1.8 percentage points against a 3.1-point range, meaning every platform in this category performs almost identically, and poorly; there is no hidden strong performer to shop for here, a disappointing result is close to guaranteed regardless of which of the three is selected. Agentic AI is the second most consistent, an 8.6 percentage point standard deviation against an 18.5-point range, but here consistency compounds a high mean rather than a low one: the category is both the strongest on average and, MiniMax-M3 aside, one of the more dependable, so committing to almost any platform in this category on the strength of the category average carries comparatively low risk of a disappointing individual result.
The three middle categories tell a more cautionary story. Open-Model Productised assistants show a 13.2 percentage point standard deviation, Frontier/Closed-Model assistants 14.3 points, and Conversational AI, on just three platforms, 16.5 points, the highest of any category in the panel. In each of these three, and especially in the two largest, Frontier and Open-Model, the category average is a considerably less reliable guide to what any single chosen platform will actually deliver than it is for Search-Native or Agentic AI; a buyer who selects a platform in these categories by category reputation alone, rather than by its own individual score, is taking on meaningfully more variance than the aggregate figures suggest. Frontier/Closed-Model illustrates this most sharply: it has the single widest range of any category, 43.1 percentage points, driven by a small number of genuine laggards, Copilot's fast mode chief among them, sitting inside an otherwise strong field; the standard deviation is lower than the range alone would suggest precisely because most of the eleven platforms cluster well above the mean, with only one or two dragging the bottom down. Range and standard deviation are telling two different stories here, range flags the worst-case outcome, standard deviation describes the typical one, and reading both, rather than either alone, is what actually reveals the shape of a category's risk.
Speed Versus Depth: Is the Deeper Tier Worth It?
The speed-versus-depth distinction introduced in this report's methodology, and visible throughout every category discussed above, deserves a direct answer of its own, since it is the one variable inside this dataset that an organisation can change at the click of a setting rather than through a lengthy procurement cycle. Pooling the speed-tier variant of every multi-variant platform against its own depth-tier variant gives a clean, panel-wide answer to a simple question: does paying the latency, cost, or waiting-time premium for the deeper mode actually buy better reasoning?
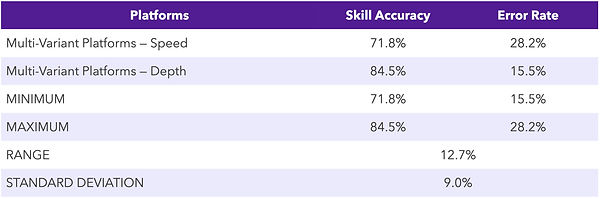
On average, yes, and by a meaningful margin: the twelve speed-tier variants average 71.8% accuracy, the depth-tier variants average 84.5%, a 12.7 percentage point gain for choosing depth. That average, however, is the least useful number in this section, because it conceals a genuinely bimodal pattern rather than a consistent, moderate uplift spread evenly across every platform.


Looking at the twelve platforms individually, the gain from switching to the depth tier splits cleanly into three groups. Four platforms show a large, unambiguous jump: ChatGPT gains 32.3 percentage points, Qwen 3.8-Max gains 29.2, Copilot gains 27.7, and Gemini gains 23.1 moving from its Flash to its Deep Think variant. Three show a moderate gain worth having but not transformative: Mistral gains 12.3 points, DeepSeek 9.2, and Grok, rebranded SuperGrok at its deeper tier, 6.1. The remaining five show a gain at or below 2 percentage points, this report's own threshold for a negligible change, or an outright loss: Claude and Kimi K3 each gain 1.5 points, ERNIE-Wenxin 5.1 loses 3.0 points, and Meta AI and You.com gain nothing at all, their speed and depth variants scoring identically. Two of these five composite figures are less settled than they look. Claude's modest 1.5 point gain and Meta AI's exact tie both average out real movement in opposite directions at the level of the individual skill, a genuine Numerical Ability loss sitting beneath Claude's small overall gain, and offsetting Verbal Reasoning and Rational Thinking shifts sitting beneath Meta AI's flat composite, both set out in full in the skill-by-skill breakdown later in this report. In practical terms, roughly four platforms in twelve justify the premium tier outright, three justify it situationally, and five do not justify it on accuracy grounds at all, though for Claude and Meta AI specifically that verdict should be checked against the skill a given task actually depends on, not read off the composite figure alone.
Two further details reinforce that the depth tier is not a universal fix. First, switching to depth barely narrows the spread between platforms: the speed-tier group has a standard deviation of 14.4 percentage points and the depth-tier group 13.6, essentially the same degree of platform-to-platform variance either way, so a poor platform choice at the fast tier tends to remain a comparatively poor choice at the slow tier too. Second, the same platform anchors the bottom of both groups: You.com (Express) is the single lowest-scoring entry among all twelve speed-tier variants at 52.3%, and You.com (Advanced) is, at an identical 52.3%, the single lowest-scoring entry among all thirteen depth-tier entries as well. Paying for the deeper tier did not move this platform at all. At the other end, Meta AI (Instant) posts the single highest score of any speed-tier variant, 93.8%, matching its own depth-tier sibling exactly at the composite level; as noted above, this tie conceals a genuine skill-level trade-off rather than a true absence of change, so it should not be read as evidence that this platform's slower mode achieves nothing, only that its net effect on this particular battery happens to be a wash.
The procurement conclusion follows directly from the data rather than from any general rule of thumb: the deeper tier is worth its premium often enough, and by a large enough margin in the strongest cases, that it should never be dismissed by default, but it is not worth it often enough, roughly four platforms in twelve show no meaningful benefit, that it should never be assumed either. The only reliable approach is to test both tiers of a specific platform against the specific task at hand before committing budget or workflow design to either one.
Practical Takeaways for Decision-Makers
Four findings from this year's results are worth carrying into procurement, budgeting, and deployment decisions directly. First, the slowdown in aggregate improvement means the platforms on the market today are a more durable basis for planning than in previous years, this is a reasonable moment to commit to a platform and invest in the surrounding workflow rather than waiting for a step-change that this year's data gives no strong reason to expect on any predictable timeline. Second, category membership is a weak predictor of accuracy on its own, agency level correlates with performance only loosely, and a platform's sub-panel should be treated as a guide to what kind of task it is built for, not a guarantee of how well it will perform at a reasoning-heavy task; every category in this panel contains both strong and weak individual performers, and the gap between the best and worst platform inside a single category is, in several cases, wider than the gap between category averages. Third, how much that category-level uncertainty matters varies sharply by category itself: Search-Native AI and Agentic AI are both internally consistent, so their category averages can be trusted with reasonable confidence, while Conversational AI, Frontier/Closed-Model, and Open-Model Productised assistants all show standard deviations above 13 percentage points, meaning the specific platform chosen inside those three categories matters as much as, or more than, the category itself. Fourth, the choice between a platform's own speed and depth variants is a real and often large lever, an average 12.7 percentage point gain from choosing depth across the panel, but an inconsistent one, roughly a third of multi-variant platforms show no meaningful benefit from their deeper tier at all, so that choice should never be left unexamined or defaulted to whichever setting happens to be fastest, cheapest, or pre-selected out of the box.
Accuracy by Skill Domain
The composite figures presented earlier provide a useful headline measure, but by averaging four distinct cognitive skills into a single score, they inevitably conceal important differences in where individual categories and platforms perform strongly or encounter difficulties. The analysis below therefore disaggregates the 2026 results into the four underlying domains: Language Skills, Verbal Reasoning, Rational Thinking, and Numerical Ability. Performance is examined successively across the whole panel, by category, platform by platform, and by speed versus depth tier. The section then places each domain in its longer-term context through its full 2023-2026 trajectory, three-year compound annual growth rate, and this year's year-over-year drift.
All Systems Combined

Averaged across all 33 platforms, the panel is strongest on Language Skills, 82.3%, and weakest on Numerical Ability, 70.2%, with Rational Thinking at 77.5% and Verbal Reasoning at 72.4% in between. That ordering is worth registering as a baseline, because it recurs, with local exceptions, throughout the more granular breakdowns that follow: producing fluent, well-formed language is, in aggregate, the panel's most reliably solved problem, while multi-step calculation remains the domain where the panel as a whole has the most room to improve. The gap between the strongest and weakest skill, 12.1 percentage points, is a first, blunt signal that the four cognitive skills this report tracks are not developing at the same pace, or reaching the same ceiling, even within a single year's snapshot.
Skill Profiles by Category

Breaking the same four skills down by category shows that the all-systems averages conceal sharply different profiles. Agentic AI leads every single one of the four skills, Language Skills at 91.7%, Verbal Reasoning at 82.5%, Rational Thinking at 97.1%, and Numerical Ability at 88.6%, without a single exception; whatever else can be said about the newest and smallest category in this panel, it is not merely strong on average, it is the strongest category on every dimension this report measures. Search-Native AI sits at the opposite end on three of the four skills, the weakest category on Verbal Reasoning (46.7%), Rational Thinking (43.1%), and Numerical Ability (30.3%), but not on Language Skills, where it scores 71.6% and actually outperforms Conversational AI's 63.0%. That distinction matters practically: Search-Native AI's underlying weakness on this battery is not an inability to produce readable language, retrieval-grounded answers tend to read perfectly fluently, it is an inability to reason and calculate in closed-book conditions, which is a materially different limitation to design around than a general one.
A second pattern is visible in the range and standard deviation rows themselves, and it holds with unusual consistency at this category level. The spread between the five category averages widens as the skill becomes more analytical: Language Skills shows the narrowest range, 28.7 percentage points, and the lowest standard deviation, 11.9 points; Verbal Reasoning follows at 35.8 points and 13.8; Rational Thinking widens further to 53.9 points and 21.3; and Numerical Ability shows both the widest range, 58.3 points, and the highest standard deviation, 24.3 points, of any skill in this breakdown. In practical terms, categories of AI system disagree with each other far more about arithmetic and multi-step calculation than they do about basic language production; nearly every category can write a coherent sentence, but only some can reliably work through a numerical problem, and that gap is the single largest source of category-to-category variance in this dataset.
Conversational AI - Low Agency

The three companionship platforms show an unusual internal pattern worth flagging on its own: all three score exactly 63.0% on Language Skills, producing a range and standard deviation of precisely zero on that skill, the only skill-category combination in the entire panel where every platform ties exactly. Whether this reflects a genuine shared ceiling on this skill for companionship-oriented systems or simply a coincidence of a small sample answering a modest number of items, it is a pattern worth watching in next year's data rather than a finding to lean on. Where the category does differentiate sharply is on the more analytical skills: Character AI collapses to 23.5% on Rational Thinking and 9.1% on Numerical Ability, the single lowest Numerical Ability score recorded by any platform in the entire 2026 panel, while Nomi reaches 82.4% and 72.7% on the same two skills respectively. As with the composite figures discussed earlier in this report, a low score here is not a defect in a companionship product, but it is a clear signal that this category should never be asked to perform calculation or multi-step reasoning work, regardless of which individual platform is chosen.
Hybrid AI Assistants - Frontier / Closed-Model

This sub-panel's skill breakdown confirms and sharpens a pattern already visible in the composite figures. Copilot (Smart) is not merely the weakest overall performer in this category, it posts the lowest Verbal Reasoning score of any platform anywhere in the 33-platform panel, 30.0%, a figure matched only by You.com (Advanced) in the Search-Native category discussed below. Its own Think Deeper variant corrects this sharply, reaching 80.0% on the same skill, a 50.0 percentage point jump, wide enough on its own to span this sub-panel's entire Verbal Reasoning range. At the strong end, Gemini 3.1 (Pro) alone records 100.0% on three of the four skills, Language, Rational Thinking, and Numerical Ability. Numerical Ability remains the least consistent skill within this sub-panel, a 63.6 percentage point range, running from Copilot (Smart)'s 36.4% up to a perfect score shared by two Gemini variants, matching the same 63.6 point spread seen in the Conversational AI category above.
Hybrid AI Assistants - Open-Model Productised

The open-weight tier's skill breakdown clarifies an anomaly already flagged at the composite level. ERNIE-Wenxin 5.1's Think Deeper variant scored lower than its own standard mode overall, and the skill breakdown shows this is driven entirely by Language Skills, which falls from 74.1% to 70.4%, and Verbal Reasoning, which falls from 80.0% to 70.0%; Rational Thinking and Numerical Ability, by contrast, stay perfectly flat at 64.7% and 54.5% in both variants. The extended-reasoning mode, in other words, appears to cost this platform some fluency and verbal precision without buying any additional analytical accuracy in return, a genuinely unfavourable trade that the composite score alone understates. Elsewhere in this sub-panel, Mistral (Fast) and Qwen 3.8-Max (Fast) both post the category's weakest Numerical Ability results, 45.5% each, while Meta AI (Instant) and several Qwen and Kimi variants clear 90% on the same skill, underlining that within this sub-panel too, Numerical Ability separates strong from weak platforms more sharply than most other skills, a 45.5 percentage point range against 33.3 points for Language Skills.
Search-Native AI

Search-Native AI's skill breakdown confirms precisely where this category's weakness originates. Its Language Skills range is remarkably tight, just 3.7 percentage points, with a standard deviation of only 2.1 points; all three platforms write fluently and consistently. On Numerical Ability, by contrast, Perplexity manages only 18.2%, the second-lowest score recorded by any platform on any skill in the entire panel, behind only Character AI's 9.1%, while You.com's two variants sit at 36.4% each. You.com (Advanced) also records this category's, and one of the panel's, lowest Verbal Reasoning scores, 30.0%, tied exactly with Copilot (Smart) in the Frontier tier above and, notably, lower than its own Express variant's 40.0%, meaning the deeper tier actively regressed on this specific skill rather than merely failing to improve it. For any task that leans on this category's retrieval strength, current information rather than closed-book calculation or logic, that distinction between what these platforms do well and what they do poorly is the one to design around.
Agentic AI - High Agency

Consistent with its category-level lead on every skill, the agentic tier's internal spread is also comparatively narrow on three of the four skills, standard deviations of 5.0 points on Verbal Reasoning, 5.9 on Rational Thinking, and 4.5 on Numerical Ability, all among the tightest recorded for any category on those skills. The exception is Language Skills, where the spread widens to a 14.3 point standard deviation, driven by MiniMax-M3, whose 70.4% Language Skills score sits well below the 96.3% to 100.0% range posted by the other three agentic platforms, even though MiniMax-M3's own Rational Thinking score, 88.2%, sits much closer to the category norm, 97.1%. That profile, comparatively strong reasoning paired with comparatively weak language production, is the inverse of the pattern seen almost everywhere else in this panel, where Language Skills is typically a platform's strongest, not weakest, result, and is worth noting as this category's one genuine outlier profile.
How Consistency Varies by Skill
Two consistency patterns emerge once every category and platform table is read together. The first, already visible at the category level, holds up reasonably well within most individual sub-panels too: in the Frontier/Closed-Model tier, standard deviation rises steadily from Language Skills (11.9) through Verbal Reasoning (15.6) and Rational Thinking (17.2) to Numerical Ability (22.0); the Open-Model Productised tier shows a broadly similar climb, from 12.9 to 17.5 to 19.2, with only Verbal Reasoning, at 8.9, breaking the pattern by coming in unusually tight. The second pattern is that this ordering is not universal. In the Search-Native tier, Verbal Reasoning, at 20.8 points, is by far the most dispersed skill, well above Numerical Ability's 10.5; unlike the pattern elsewhere in this sub-panel, where the three platforms cluster tightly, on this one skill they are genuinely spread across a wide band, from Perplexity's 70.0% down to You.com (Advanced)'s 30.0%, rather than one platform pulling away from an otherwise uniform pair. In the Agentic tier, conversely, Language Skills, at 14.3 points, is the most dispersed, not the least, and here the pattern is a single outlier, MiniMax-M3, pulling away from three closely clustered peers. The practical reading is that the general tendency for the more analytical skills to separate platforms more sharply is real and worth planning around, but it is a tendency, not a rule, and in the smaller categories in particular, three or four platforms rather than eleven or twelve, a single unusual result is enough to override it. Small-category dispersion figures, as this report's methodology has noted elsewhere, should be read as indicative rather than statistically definitive.
Speed Versus Depth, by Skill

Pooling every multi-variant platform's speed-tier score against its own depth-tier score, by skill rather than as a single composite, shows that the benefit of the deeper, slower mode is not evenly spread across the four cognitive skills. The gain from choosing depth is smallest for Language Skills, 79.9% rising to 86.9%, a 7.0 percentage point improvement, and largest for Numerical Ability, 61.4% rising to 82.5%, a 21.2 point improvement; Rational Thinking shows a similarly large gain, 68.6% to 86.9%, 18.3 points, while Verbal Reasoning falls in between at 9.5 points. In practical terms, extended-reasoning modes appear to buy considerably more accuracy on calculation and multi-step logic than they do on fluent language production, which already scores comparatively well even at the faster, cheaper tier.
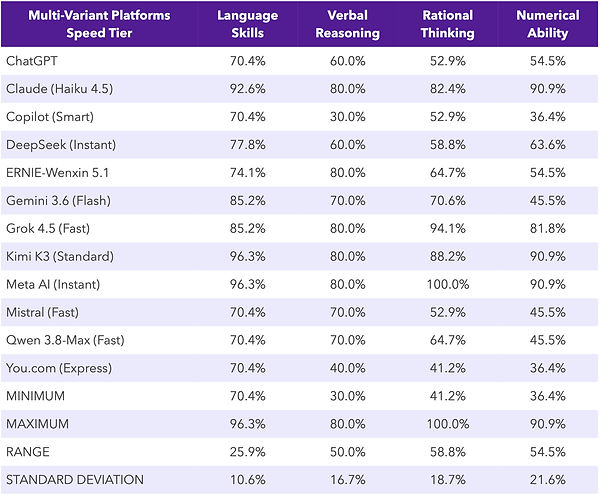

The platform-level detail behind that average splits into large and negligible effects rather than a smooth, uniform uplift, and the single largest movement recorded anywhere in this breakdown belongs to Gemini: its Numerical Ability score rises from 45.5% to 100.0% between the Flash and Deep Think variants, a 54.5 percentage point gain, the largest skill-specific improvement in this year's entire speed-versus-depth dataset. Two further cases come close. Copilot's Verbal Reasoning rises by 50.0 points, from 30.0% to 80.0%, between its Smart and Think Deeper variants, exactly matching this skill's entire range across the whole Frontier/Closed-Model sub-panel, so Copilot alone spans that category's full spread between its two tiers; and ChatGPT's Rational Thinking rises by 47.1 points, from 52.9% to 100.0%, between its base and Plus tiers. Qwen 3.8-Max's Numerical Ability and Copilot's own Numerical Ability each add a further 45.4 points, moving from their respective speed to depth tiers.
Not every platform moves in the same direction, and the exceptions are as instructive as the gains. Claude's Numerical Ability actually falls, from 90.9% to 81.8%, a 9.1 point regression between Haiku 4.5 and Sonnet 5, while ERNIE-Wenxin 5.1 loses 10.0 points on Verbal Reasoning and You.com loses the same 10.0 points on the same skill moving to their respective deeper tiers. None of these three losses is large enough to reverse the platform's overall standing, but each is a reminder that a deeper, slower tier is not a strictly dominant choice on every skill, even where it helps on balance.
One case deserves particular attention because it corrects, rather than merely restates, an earlier finding in this report. Meta AI's Instant and Thinking variants were shown to post an identical composite accuracy score, suggesting no benefit from the deeper mode. The skill-level breakdown shows this apparent tie conceals real movement in both directions: Verbal Reasoning actually improves, from 80.0% to 90.0%, while Rational Thinking declines, from 100.0% to 94.1%, with Language Skills and Numerical Ability unchanged. The composite score's flat reading is therefore not a sign that the Thinking mode does nothing; it is a coincidence of two opposite effects of similar size cancelling out. An organisation using Meta AI specifically for verbal or written tasks would see a real benefit from the deeper mode that the headline composite score hides entirely, while one relying on it for rule-based or logical judgement would see a real, if modest, cost. This is a clear practical illustration of why a single composite figure, useful as a first filter, should never be the last word in a procurement decision where the task at hand maps clearly onto one of the four skills rather than an even blend of all four.
You.com supplies the clearest negative case overall. Its Advanced tier does not merely fail to improve on its Express tier, as this report's composite-level analysis already showed; the skill breakdown shows an outright regression on Verbal Reasoning, from 40.0% to 30.0%, alongside flat results on Language Skills and Numerical Ability and only a marginal gain on Rational Thinking, from 41.2% to 47.1%. For this specific platform, selecting the deeper, slower tier carries a real cost on at least one skill and no meaningful benefit on the others, the clearest possible illustration that a platform's own marketing distinction between a fast and an advanced mode should never be taken as a guarantee of improved accuracy without checking the specific skill a task actually depends on.
Two points follow directly from this skill-level view and are worth adding to the procurement and deployment guidance already set out in this report. First, matching a platform to a task is more precise when done skill by skill rather than by composite score alone: a platform with a mediocre composite result can still be a strong choice for a task that depends mainly on the one skill it happens to be strong in, and a platform with a good composite result can still be a poor choice for a task that depends on the one skill it happens to be weak in. Second, the case for the deeper tier is itself skill-dependent, worth paying for on tasks that are calculation- or logic-heavy, where the gains recorded this year are large and consistent, and far less consequential, occasionally even counter-productive, on tasks that are primarily about producing well-formed language, where the faster, cheaper tier already captures most of the achievable accuracy.
AI Drift, 2023-2026

Four years of measurement now make it possible to see the shape of each skill domain's trajectory, not just its most recent movement. Two domains, Language Skills and Numerical Ability, have climbed in every single year since the study began, from 62.0% to 82.3% and from 34.0% to 70.2% respectively, though both show the same deceleration already noted at the composite level: Language Skills' annual gains have run 9.4, 6.4, and 4.5 percentage points across the three intervals measured, and Numerical Ability's have run 13.1, 20.7, and 2.4. The other two domains, Verbal Reasoning and Rational Thinking, both grew for two consecutive years before turning down this year. Verbal Reasoning rose sharply from 30.0% in 2023 to 76.7% in 2025, gaining 30.0 points in its first year alone, before falling to 72.4% in 2026. Rational Thinking followed a similar arc, from 44.0% in 2023 to a peak of 81.1% in 2025, before falling to 77.5%. This year is therefore the first in the study's four-year record in which any domain has declined at all, and it is exactly the two domains already identified elsewhere in this analysis as the ones most closely tied to judgement-dependent work that have done so.
The three-year compound annual growth rate needs to be read alongside the cross-sectional and year-over-year figures rather than in isolation, a distinction already illustrated at the subtest level elsewhere in this report. Verbal Reasoning posts the highest CAGR of the four domains, 34.1%, driven by its very low 2023 starting point, 30.0%, the lowest of any domain that year, combined with genuinely strong growth through 2025; but that same domain is now the one furthest past its peak, which means the high compound growth rate describes where it has come from more than where it currently stands. Numerical Ability's CAGR, 27.4%, and Rational Thinking's, 20.8%, both sit closer to what their absolute trajectories would suggest, since neither domain has reversed as sharply as Verbal Reasoning has. Language Skills posts the lowest CAGR, 9.9%, not because its underlying growth has been weak, its climb has been positive in every year measured, but because it started from the highest 2023 base of the four domains, 62.0%, which mechanically compresses how large a compound growth rate can register even for a domain performing consistently well.
The past twelve months alone show the split already reported earlier in this analysis: Language Skills and Numerical Ability continued climbing, by 4.5 and 2.5 points respectively, while Verbal Reasoning and Rational Thinking fell, by 4.2 and 3.6 points. Seen against the fuller four-year record, this year's declines in Verbal Reasoning and Rational Thinking are not yet distinguishable from a single weaker year following two years of strong growth, but they are also the first declines either domain has recorded in this study's history, which is reason enough to treat next year's reading, not this year's alone, as the one that will show whether this is a genuine turn or a one-year interruption to an otherwise upward path.
The caveats already set out for this report's other drift figures apply here in full, and this domain-level view adds one further observation worth carrying forward: a high three-year compound growth rate and a current-year decline are not mutually exclusive, and Verbal Reasoning is this year's clearest illustration of that at the domain level, just as specific subtests illustrate the same point in the more detailed breakdowns elsewhere in this report. Four years of data remains a short record for separating a genuine multi-year plateau, or reversal, from ordinary year-to-year variation, and this year's declines in two of the four domains are best treated as a signal to watch closely rather than a conclusion to act on.
Language Skills, Subtest by Subtest
Language Skills, the strongest of the four cognitive skill domains reported earlier in this analysis, is itself made up of five distinct subtests: Antonym Recognition, Language Comprehension, Word Substitution, Syntactic Organisation, and Synonym Recognition. This section unpacks the 2026 snapshot at that level of detail, across the whole panel, by category, platform by platform, and by speed versus depth tier, and closes with the full 2023-2026 trajectory for each subtest, including the three-year compound annual growth rate and this year's year-over-year drift.
All Systems Combined

The headline finding at this level of detail is that Language Skills' strong domain-level score conceals a sharp internal split. Three of the five subtests are, in practical terms, solved problems for this panel: every one of the 33 platforms tested scores a perfect 100.0% on Synonym Recognition, and all but two score a perfect 100.0% on Antonym Recognition and Word Substitution, averaging 98.5% and 99.5% respectively across the panel. That matters operationally more than it might sound. Antonym Recognition underpins the precise word choice a contract, a regulation, or a technical specification depends on, getting "mandatory" and "optional" right, or "shall" and "may", and Synonym Recognition underpins both natural-sounding generated text and effective search, finding the right document even when a user's search term is not the exact word the source used. Word Substitution is the compression skill behind concise headlines, ticket categories, and metadata tags. All three capabilities can now be assumed present in essentially any platform on the market, and none is worth spending evaluation time on when comparing vendors.
The other two subtests tell a very different story. Language Comprehension, extracting the correct meaning from a passage of text, averages just 66.7% across the panel, and Syntactic Organisation, assembling a coherent, grammatical sentence from a disordered set of words, averages only 55.2%, the weakest of the five, lower even than the panel-wide Numerical Ability average reported earlier. These two subtests, not the other three, are where a platform's real Language Skills strengths and weaknesses show up in practice, and they are the two worth testing directly before relying on a platform for comprehension-heavy or drafting-heavy work: triaging correspondence, summarising a case file, or assembling a notice from templated components.
Skill Subset Profiles by Category

Breaking the two differentiating subtests down by category confirms that saturation on the other three is not a category-specific artefact: every category averages exactly 100.0% on Antonym Recognition and Synonym Recognition, and between 97.2% and 100.0% on Word Substitution, a spread so narrow it produces a standard deviation of essentially zero on all three. The real variation is concentrated entirely in Language Comprehension, ranging from 50.0% in both Conversational AI and Search-Native AI up to 87.5% in Agentic AI, and Syntactic Organisation, ranging from a stark 3.7% in Conversational AI up to 77.8% in Agentic AI, a 74.1 percentage point spread, the widest range recorded for any subtest at the category level in this domain.
Agentic AI leads both of the genuinely differentiating subtests, consistent with its lead across every skill domain reported so far. Conversational AI's Syntactic Organisation score of 3.7% deserves particular attention: it reflects two of the category's three platforms scoring a flat 0.0%, unable to construct a single correctly-ordered sentence from a scrambled set of words, with the third managing only a modest 11.1%. In practical terms, this category cannot currently be trusted with any task that involves assembling text from structured or tagged components, merge-field correspondence, templated notices, auto-generated product listings, regardless of which platform within it is chosen.
Conversational AI - Low Agency

The category table already flags Syntactic Organisation as this category's defining weakness, and the platform detail confirms it is not an isolated result: Nomi and Replika both score exactly 0.0%, and Character AI, the strongest of the three on this subtest, still manages only 11.1%. Word Substitution is the partial exception, Character AI dips to 91.7% while Nomi and Replika both reach 100.0%, but even this is a comparatively minor gap set against the near-total failure on Syntactic Organisation. Language Comprehension is uniform and unremarkable across the category, all three platforms score exactly 50.0%, meaning each can be expected to correctly interpret only about half of what it is asked to read, a result that should rule this category out for any comprehension-dependent task regardless of which of the three platforms is chosen.
Hybrid AI Assistants - Frontier / Closed-Model

This sub-panel's Language Comprehension results illustrate the strict binary character of that subtest particularly clearly: five platforms, ChatGPT, ChatGPT Plus, both Claude variants, and Copilot (Smart), score exactly 50.0%, while the remaining six score exactly 100.0%, with no intermediate result anywhere in the category. That binary pattern holds across the entire 33-platform panel; every recorded Language Comprehension score in this report is either exactly 50.0% or exactly 100.0%, with nothing in between, consistent with a very small number of items underlying this particular subtest and worth reading as a coarse pass-or-fail signal rather than a fine-grained score. Syntactic Organisation shows this sub-panel's clearest speed-versus-depth story: Copilot (Smart) and ChatGPT both score only 22.2%, while ChatGPT Plus and several deeper-tier variants reach a full 100.0%, a pattern examined in more detail in the speed-versus-depth section below.
Hybrid AI Assistants - Open-Model Productised
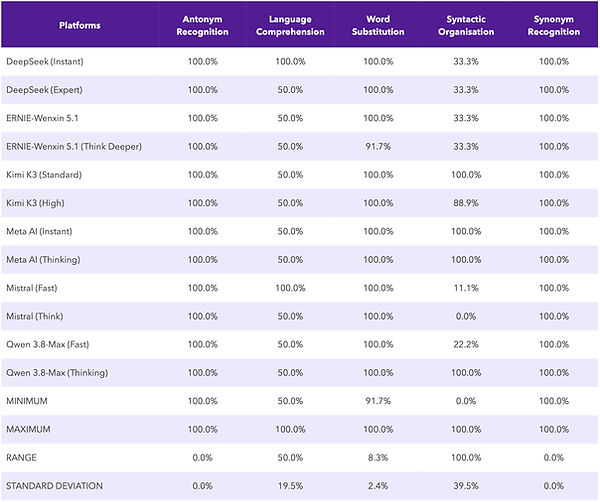
ERNIE-Wenxin 5.1's Think Deeper variant is one of only two platforms in the entire panel to fall short of a perfect Word Substitution score, 91.7% against a perfect 100.0% for its own standard mode, the same 91.7% recorded by Character AI in the Conversational category. Syntactic Organisation again supplies this sub-panel's widest spread, from Mistral (Think)'s 0.0% up to a perfect 100.0% shared by four platforms, Kimi K3 (Standard), both Meta AI variants, and Qwen 3.8-Max (Thinking), a 100 percentage point range, the widest spread recorded for any subtest in any of this domain's category tables. Mistral's own pair of variants is worth flagging on its own: its Fast tier already manages only 11.1% on Syntactic Organisation, and its Think tier falls further still, to 0.0%, one of the few cases in this domain's data where the deeper, slower tier is outright worse than the faster one on the subtest that matters most for this skill.
Search-Native AI

This sub-panel is the most internally consistent in the Language Skills breakdown, unsurprising given it holds only three platforms, with a standard deviation at or close to zero on four of the five subtests. The one exception is again Syntactic Organisation, where Perplexity's 33.3% sits ahead of both You.com variants at 22.2% each, a comparatively narrow 11.1 point range next to the wider spreads seen elsewhere in this domain, but a reminder that even this sub-panel's tightest results are not immune to the Syntactic Organisation weakness affecting the wider market. All three platforms share the same 50.0% Language Comprehension result already seen in the Conversational category, underscoring that this limitation, correctly interpreting only about half of a given passage, is not confined to any one category or agency level.
Agentic AI - High Agency

Consistent with its category-level lead on both differentiating subtests, three of the four agentic platforms, Genspark AI, SuperNinja Agent, and Z.ai Agent, score 100.0% or close to it on both Language Comprehension and Syntactic Organisation. MiniMax-M3 is the exception on both counts, 50.0% on Language Comprehension and 22.2% on Syntactic Organisation, consistent with its position as this category's weaker performer noted elsewhere in this report, though even MiniMax-M3's Syntactic Organisation score still comfortably clears Conversational AI's category average. The practical reading for this category is that its overall strength on Language Skills is not evenly shared: three of its four platforms are excellent across the board, while the fourth, though still far ahead of the weakest categories in this domain, is the one agentic platform where comprehension- or drafting-heavy tasks warrant closer checking before deployment.
Where the Panel Actually Differs
Five subtests were tested, but only two of them, Language Comprehension and Syntactic Organisation, currently do any real work separating a strong platform from a weak one; the other three are effectively solved across the market and should be dropped from any procurement checklist that is trying to discriminate between vendors rather than confirm a baseline. Of the two subtests that matter, Syntactic Organisation is both the weaker on average, 55.2% against 66.7%, and the more erratic, a category-level standard deviation of 31.0 points against 17.0, and it is also the subtest most sensitive to the speed-versus-depth choice, examined next. A platform's Language Comprehension score, by contrast, tends to be a fixed property of the platform rather than something a faster or slower mode changes, with two notable exceptions covered below, which makes it a comparatively reliable, one-off check to run before committing to a platform for any task that depends on reading and correctly interpreting text: a citizen enquiry, a contract clause, an incident report, or a piece of correspondence.
Speed Versus Depth, by Subtest

Pooled across all twelve multi-variant platforms, the modest 7.0 percentage point gain already reported for Language Skills as a whole when moving from the speed to the depth tier turns out to come entirely from a single subtest. Syntactic Organisation improves sharply with depth, from 47.2% to 69.2%, a 22.0 point gain, while Language Comprehension and Word Substitution both move slightly in the opposite direction, Language Comprehension falling from 66.7% to 65.4% and Word Substitution from 100.0% to 99.4%. Antonym Recognition and Synonym Recognition, as elsewhere in this analysis, stay perfectly flat at 100.0% regardless of tier. In other words, the case for paying for a deeper Language Skills tier rests almost entirely on Syntactic Organisation; a task that depends mainly on comprehension or vocabulary substitution gains little, and by a hair loses ground, from the more expensive option.


The platform-level detail behind that average shows the Syntactic Organisation gains concentrated in a handful of large moves rather than spread evenly across the sub-panel. ChatGPT improves from 22.2% to 100.0% between its base and Plus tiers, and Qwen 3.8-Max improves by the same 77.8 percentage points moving from Fast to Thinking, the two largest single-subtest movements recorded anywhere in this year's Language Skills data. Gemini and Grok both add 44.4 points moving to their deeper tiers. Against these gains, four platforms show no Syntactic Organisation movement at all between tiers, Copilot, DeepSeek, Meta AI, and You.com all score identically on this subtest regardless of which variant is selected, and two platforms actually regress, Kimi K3 falls by 11.1 points and Mistral falls by the same amount, the latter compounding an already weak 11.1% Fast-tier result into a 0.0% Think-tier one.
Language Comprehension supplies this section's clearest warning. Because every recorded score on this subtest is either exactly 50.0% or exactly 100.0%, any platform that moves at all moves by a full 50 percentage points, and two platforms move in the wrong direction: DeepSeek falls from a perfect 100.0% on its Instant tier to 50.0% on its Expert tier, and Mistral falls from 100.0% on Fast to 50.0% on Think, the same pattern in both cases. For these two platforms specifically, the slower, more expensive tier does not just fail to help comprehension, it measurably and substantially hurts it, a clear illustration that a platform's own branding of a mode as smarter or more expert carries no guarantee across every subtest, even within a single skill domain.
Two practical conclusions follow. First, three of the five Language Skills subtests, Antonym Recognition, Word Substitution, and Synonym Recognition, can now be treated as solved for procurement purposes and dropped from any vendor comparison that is trying to find real differences between platforms; the differentiating work in this skill domain happens entirely in Language Comprehension and Syntactic Organisation. Second, the deeper tier is worth paying for when a task depends specifically on Syntactic Organisation, assembling correspondence, notices, or structured documents from component parts, where this year's gains are large and consistent, but it should not be assumed to help, and should be explicitly checked, where a task depends on Language Comprehension: two platforms in this year's panel score markedly worse at reading comprehension in their slower, costlier mode than in their faster one.
AI Drift, 2023-2026

Language Skills' four-year trajectory shows a pattern shared by three of its five subtests and broken in a distinctive way by the other two. Antonym Recognition climbed steadily throughout the period, from 70.0% in 2023 to 98.5% in 2026, with its largest single-year gain, 15.8 points, coming between 2024 and 2025. Syntactic Organisation climbed just as steadily from a far lower base, 20.0% in 2023 to 55.2% in 2026, gaining ground in every single year of measurement. Word Substitution and Synonym Recognition both approached their current ceiling early, the former rising smoothly from 90.0% to a peak of 100.0% in 2025 before a marginal 0.5 point dip this year, the latter reaching a perfect 100.0% as early as 2024 and holding there since. Language Comprehension is the exception to this pattern: rather than a steady climb, it rose from 50.0% in 2023 to 57.1% in 2024, fell back to 44.4% in 2025, a 12.7 point decline, and then rebounded sharply to 66.7% in 2026, a 22.3 point gain. It is the only subtest in this domain with a genuinely non-monotonic path across the four years measured, and this year's large increase needs to be read against that prior dip rather than as an unbroken upward trend.
The three-year compound annual growth rate underlines just how far Syntactic Organisation has travelled relative to the rest of the domain. Its CAGR, 40.3%, is more than three times the next-highest figure in this domain and reflects both its low 2023 starting point and a genuinely large absolute gain, 35.2 percentage points, the largest of any subtest in this domain. Unlike a case where a high compound growth rate masks a persistently weak current result, Syntactic Organisation's climb is real by both measures, though, as this chapter's cross-sectional analysis already showed, it remains the domain's weakest subtest in 2026 even after the fastest three-year growth of any of the five; a large compound growth rate from a low base is not, on its own, evidence that a subtest has caught up to its peers. Word Substitution sits at the opposite end, a 3.4% CAGR that reflects genuine stability rather than stagnation: the subtest was already close to its ceiling in 2023, 90.0%, leaving little room for a high compound growth rate to register even as the subtest performed consistently well throughout. Antonym Recognition and Synonym Recognition, at 12.1% and 7.7% respectively, sit in between, both subtests that started from a reasonably strong base and have continued closing the remaining gap to full saturation.
The past twelve months alone show a domain that improved overall, a 4.5 percentage point gain already reported at the domain level, but unevenly across its five components. Language Comprehension's 22.2 point rebound accounts for close to seven-tenths of the combined movement recorded across all five subtests this year, comfortably the largest single contributor. Syntactic Organisation added a further 5.2 points, continuing its steady multi-year climb; Antonym Recognition added 4.0; Word Substitution slipped by a marginal 0.5; and Synonym Recognition, already at its ceiling, did not move. Read alongside the 20242025 dip noted above, Language Comprehension's outsized role in this year's improvement is best treated as a partial recovery from a prior decline rather than a fresh, independent gain, a distinction worth carrying into next year's edition when this subtest's next movement is assessed.
This multi-year view also sharpens a distinction between two different kinds of volatility touched on earlier in this chapter. Within a single year's snapshot, Syntactic Organisation was shown to be the subtest most sensitive to a platform's choice of speed or depth tier, with individual platforms swinging by as much as 77.8 percentage points between their two variants, while Language Comprehension's own tier-to-tier movement was comparatively contained, and strictly binary where it occurred. Across years, the pattern reverses: Syntactic Organisation's movement from one year to the next has been steady and gradual throughout the full four-year window, while Language Comprehension has already reversed direction once and moved by more than twenty points in a single year, twice. Sensitivity to which tier a platform's own product team assigns and sensitivity to which twelve months a platform is tested in are two different kinds of volatility, and this domain's data shows they do not attach to the same subtest.
The caveats already raised for this report's other drift figures apply here as well: four years of data is still a short record for separating a genuine trend from ordinary year-to-year variation, particularly for a subtest like Language Comprehension that has already reversed direction once within that window, and this data cannot on its own distinguish genuine platform-level change from the effect of this year's larger and restructured panel. What the multi-year view adds to this domain's story is a clearer sense of trajectory shape, not just direction: Syntactic Organisation's climb has been gradual and consistent and is likely to continue closing the gap to the rest of the domain if the pattern holds, while Language Comprehension's path has already shown it can move sharply in either direction within a single year, which argues for treating any one year's reading on that specific subtest with more caution than the others.
The same two caveats raised for the domain-level drift figures apply here with equal force, and arguably more so given the scale of the Language Comprehension movement: this is a single year-over-year comparison, not yet enough to establish a sustained trend, and it cannot on its own distinguish genuine platform-level improvement from the effect of this year's larger and different panel. A 22.2 point swing on one subtest is large enough to warrant a closer look in next year's edition, not an assumption that it will repeat.
Verbal Reasoning, Subtest by Subtest
Five distinct subtests underpin the Verbal Reasoning domain: Word Categorisation, Deductive Reasoning, Linguistic Cohesion, Quantitative Analysis, and Spatial Awareness. Rather than treating the domain as a single aggregate measure, the following analysis examines how performance is distributed across these five components in 2026. Results are considered at whole-panel level, across categories, for individual platforms, and between speed versus depth tiers. A longitudinal perspective follows, tracing the full 2023-2026 trajectory of every subtest and reporting both its three-year compound annual growth rate and this year's year-over-year drift.
All Systems Combined

Before turning to the results, a methodological note applies across all five of these subtests rather than to just one. Every recorded platform-level score in this year's Verbal Reasoning data falls at exactly 0.0%, 50.0%, or 100.0%, with no values in between anywhere in the panel; the smoother-looking percentages in the tables that follow, 62.1% or 89.4%, are averages computed across many platforms, not a finer-grained score achieved by any single one of them. This is consistent with each subtest resting on a very small number of items per platform, most likely two, and it means every figure in this section should be read as a coarse signal rather than a precise measurement: a single item answered differently can move an individual platform's score by a full 50 percentage points.
With that caveat in place, the domain splits into three comparatively strong subtests and two genuinely weak ones. Linguistic Cohesion leads at 89.4%, followed by Spatial Awareness at 86.4% and Quantitative Analysis at 83.3%. Word Categorisation trails at 62.1%, and Deductive Reasoning is the weakest of the five, at just 40.9%, below the halfway mark on a subtest with essentially two graded outcomes per item.
Each subtest maps onto a distinct daily task. Word Categorisation, sorting a list of items into groups by shared trait, underpins the automatic triage of a mixed inbox of citizen enquiries, complaints, or support tickets into the right queue without a person pre-sorting them by hand; a 62.1% panel average means roughly two in five items would still need a human check on the initial sort. Deductive Reasoning, drawing a valid conclusion from a set of given premises, is the mechanism behind automatically checking whether a case meets published eligibility criteria or whether a contractual condition has actually been triggered; at well under half accuracy panel-wide, this is concrete evidence that AI-assisted eligibility and compliance determinations still need a human check on every case, not only the borderline ones, regardless of which platform is used. Linguistic Cohesion, tracking the transitions, pronouns, and logical links that hold a passage together, is what lets a system draft or summarise a long report, a policy briefing, an audit, without losing the thread or contradicting itself across pages; the panel's strong showing here supports confident use for long-document work. Quantitative Analysis, reasoning about numbers embedded in a written problem, underpins drafting or checking a budget narrative where the prose and the figures need to agree; solid but imperfect performance here still warrants a spot check on complex, multi-step scenarios. Spatial Awareness, interpreting a written description of a physical layout, supports an early read of a logistics or site-planning document; strong panel-wide performance makes this a reasonable triage tool, though not a substitute for specialist review.
Skill Subset Profiles by Category

Deductive Reasoning's weakness is universal rather than concentrated in any one category: every category in this panel averages 50.0% or below, Agentic AI at the ceiling with exactly 50.0%, Frontier/Closed-Model close behind at 45.5%, Open-Model Productised at 41.7%, Conversational AI at 33.3%, and Search-Native AI at just 16.7%. Not one of the five categories clears the halfway mark on deductive reasoning, which means the choice of category, or of agency level, offers no real protection against this specific weakness; it has to be managed through human oversight of the task itself, not through platform selection.
Quantitative Analysis tells the opposite kind of story: not universally weak, but the most category-dependent of the five subtests in this domain. Its category-level range, 83.3 percentage points, from Search-Native AI's 16.7% up to a perfect 100.0% shared by Agentic AI and Open-Model Productised assistants, and its standard deviation, 33.5 points, are both the largest recorded among this domain's five subtests. Search-Native AI's collapse here is driven by two of its three platforms, You.com's Express and Advanced variants, scoring a flat 0.0%, unable to solve a single quantitative-analysis item correctly; only Perplexity, at 50.0%, keeps the category average above zero.
One further result cuts against the grain of this report's established pattern. Nomi, a low-agency companionship platform, is the only one of the 33 platforms in the entire panel to score above 50.0% on Deductive Reasoning, reaching a perfect 100.0% while every frontier, open-model, search-native, and agentic platform tops out at 50.0% or below. Given the small number of items behind this subtest, this is better read as a data point worth re-checking in next year's edition than as evidence that a companionship app genuinely out-reasons every general-purpose and agentic system in this panel, but it is a real, verified result in this year's data and a useful reminder that category averages, however informative, do not rule out individual surprises.
Conversational AI - Low Agency

The category table already flags Nomi's outlier Deductive Reasoning score; the platform detail shows this sits alongside two very different partners. Character AI and Replika both score 0.0% on the same subtest, so the category's already-modest 33.3% average rests entirely on one platform's result, not on any broad-based competence. Character AI is also this category's weakest all-round performer on the more advanced subtests, 50.0% on Quantitative Analysis and Spatial Awareness against 100.0% for both Nomi and Replika on the same two subtests, extending a pattern already established elsewhere in this report that Character AI is consistently the weakest platform in this category on tasks that move beyond basic conversation.
Hybrid AI Assistants - Frontier / Closed-Model

This sub-panel supplies two clear platform-level warnings. Copilot (Smart) is the only Frontier platform to score 0.0% on Deductive Reasoning, while every one of its ten peers reaches the category's 50.0% ceiling, extending this platform's now-familiar pattern of underperforming its own Think Deeper variant and the wider field alike. ChatGPT's base tier is the only platform in this sub-panel to score 0.0% on Spatial Awareness, a complete miss that its own Plus tier corrects to a perfect 100.0%. Word Categorisation shows this sub-panel's widest internal spread, 50.0 percentage points, with Claude (Sonnet 5) and Gemini 3.1 (Pro) alone reaching 100.0% against a 50.0% baseline shared by the other nine platforms.
Hybrid AI Assistants - Open-Model Productised

Linguistic Cohesion is this sub-panel's one point of complete uniformity: all twelve platforms score exactly 100.0%, with zero spread. Deductive Reasoning shows this sub-panel's clearest speed-to-depth pattern: DeepSeek and Mistral both move from a flat 0.0% on their faster tier to the shared 50.0% ceiling on their deeper tier, a full recovery rather than a partial one, though neither platform, nor any other in this sub-panel, exceeds that ceiling. Quantitative Analysis and Spatial Awareness both show a modest but real split; ERNIE-Wenxin sits at 50.0% on Quantitative Analysis against 100.0% for most of its peers, a reminder that even within a broadly strong sub-panel, individual subtests can expose a specific platform's weaker side.
Search-Native AI

This sub-panel records a 16.7% Deductive Reasoning average, the weakest of any category on this subtest, and the collapse is not confined to that one subtest. Quantitative Analysis fares just as badly: You.com's Express and Advanced variants both score a flat 0.0%, with only Perplexity, at 50.0%, keeping the sub-panel average above zero, and the two You.com variants score identically across both subtests regardless of tier, extending the now-familiar finding elsewhere in this report that this platform's deeper tier delivers no measurable benefit. Linguistic Cohesion is this sub-panel's one point of consistency, all three platforms at exactly 50.0%, which, combined with the results above, makes a clear case that Search-Native AI platforms, whatever their retrieval strengths, should not currently be relied upon for any task that depends on deductive or quantitative reasoning, regardless of which of the three is chosen.
Agentic AI - High Agency

This is the most uniform sub-panel in the Verbal Reasoning breakdown: three of the five subtests, Linguistic Cohesion, Quantitative Analysis, and Spatial Awareness, show zero spread across all four platforms, every one at a perfect 100.0%. Deductive Reasoning is equally uniform, but at the category ceiling rather than above it, all four platforms at exactly 50.0%, the same hard limit observed in every other category in this domain. Genspark AI is the only agentic platform to reach 100.0% on Word Categorisation, this sub-panel's sole point of differentiation; the other three all sit at 50.0%. Even in this panel's strongest and most consistent category, Deductive Reasoning is the one subtest that never breaks the 50.0% mark, underlining how specific and how widespread this particular weakness is across the entire 2026 panel.
Where the Panel Actually Differs
Two findings from this subtest-level view deserve to travel together into any procurement or deployment decision. Deductive Reasoning is not a subtest where some categories or platforms are strong and others weak; it is a subtest where, with a single exception on a very small item count, nothing in the entire 33-platform panel exceeds 50.0% accuracy, which makes it a clear case for mandatory human review of any AI-assisted eligibility, compliance, or rule-based determination, independent of vendor choice. Quantitative Analysis is the opposite kind of finding, not universally weak but the most category-dependent subtest in this domain, ranging from a 16.7% collapse in Search-Native AI to a perfect 100.0% in both Open-Model Productised and Agentic AI, which means the right platform choice for a numbers-in-prose task varies enormously by category in a way it does not for most of the other subtests examined here.
Speed Versus Depth, by Subtest

Four of the five subtests improve when moving from the speed to the depth tier, in some cases substantially: Spatial Awareness gains 17.3 percentage points, from 75.0% to 92.3%; Quantitative Analysis gains 13.5 points, from 75.0% to 88.5%; Deductive Reasoning gains 12.9 points, from 33.3% to 46.2%; and Word Categorisation gains 7.1 points, from 58.3% to 65.4%. Linguistic Cohesion is the exception, and it moves in the wrong direction, falling 3.2 points, from 91.7% to 88.5%, a small but genuine regression on the one subtest in this domain that was already performing best. Even after the largest relative gain in this section, Deductive Reasoning's depth-tier average, 46.2%, still falls short of a coin flip, confirming that the deeper, slower tier narrows this domain's most serious weakness without resolving it.


The platform-level detail behind the Deductive Reasoning gain shows a clean, binary pattern rather than a graduated improvement. Three platforms, Copilot, DeepSeek, and Mistral, move from a flat 0.0% on their speed tier to the shared 50.0% ceiling on their depth tier, a complete recovery in each case; eight platforms show no movement at all, already at 50.0% on both tiers; and You.com remains at 0.0% on both, the platform's now-familiar pattern of showing no benefit from its deeper tier extending to this subtest as well. No platform, at either tier, exceeds the 50.0% ceiling that appears to cap this subtest across the whole panel.
Linguistic Cohesion's aggregate regression traces to a specific, verifiable case rather than a broad decline. Claude falls from a perfect 100.0% on its Haiku 4.5 speed tier to 50.0% on its Sonnet 5 depth tier, a genuine 50 percentage point drop on this specific subtest, consistent with a pattern already noted elsewhere in this report that Claude's depth tier does not uniformly outperform its speed tier across every skill. You.com's Advanced tier again matches its own Express tier exactly, 50.0% on both, extending this platform's pattern of showing no measurable change on this subtest either, for better or worse.
Two conclusions follow directly from this subtest-level view. First, Deductive Reasoning should be treated as an open weakness across the entire market rather than a solvable-by-platform-choice problem: no category, and all but one platform on a small item count, clears 50.0% accuracy at either tier, so any task resembling an eligibility check, a compliance determination, or a rule-application decision needs a human reviewer on every case this year, not a spot check on the difficult ones. Second, the deeper tier is worth using for most of this domain's subtests, Spatial Awareness and Quantitative Analysis show large, genuine gains, but it should not be assumed to help Linguistic Cohesion specifically, where this year's data shows a small aggregate regression driven in part by Claude's own tier-to-tier drop on that one subtest.
AI Drift, 2023-2026

Verbal Reasoning's four-year trajectory, from the panel's original 2023 baseline through this year's snapshot, shows the same broad pattern already reported at the composite level for the panel as a whole: rapid early growth followed by a marked slowdown, and in this domain's case, an outright reversal over the past year for most of its subtests. Word Categorisation climbed from 40.0% in 2023 to 61.1% in 2025 before nearly stalling, gaining just 1.0 point this year, to 62.1%. Deductive Reasoning jumped from a very low 10.0% in 2023 to 44.4% by 2025, then fell back to 40.9%, its only decline across the four years measured. Linguistic Cohesion rose from 20.0% to a peak of 94.4% in 2025, the sharpest climb of any subtest in this domain, before easing back to 89.4%. Quantitative Analysis and Spatial Awareness both nearly doubled between 2023 and 2024, from an identical 40.0% starting point to 78.6% each, continued climbing through 2025, and then diverged in 2026: Quantitative Analysis fell sharply, by 11.1 points, while Spatial Awareness held comparatively steady, losing just 2.5.
The three-year compound annual growth rate needs to be read alongside the cross-sectional results in this chapter, not instead of them, because the two can point in different directions. Linguistic Cohesion posts the highest three-year CAGR in this domain, 64.7%, consistent with both its large absolute gain and its position as the domain's strongest subtest today. Deductive Reasoning posts the second-highest CAGR, 59.9%, which on its own might suggest a subtest rapidly closing in on a solved state. The cross-sectional data earlier in this chapter shows the opposite: Deductive Reasoning remains capped at 50.0% or below for every category and all but one platform in the entire panel, and its 2026 score, 40.9%, is now lower than it was in 2024, 42.9%. The high CAGR here is largely an artefact of an extremely low starting point, 10.0% in 2023, rather than evidence of a capability on a clear path to resolution; a high compound growth rate computed from a low base is not the same claim as a high or adequate absolute accuracy, and Deductive Reasoning is this domain's clearest illustration of that distinction. By contrast, Word Categorisation's CAGR is the lowest of the five, 15.8%, not because it improved by less in absolute terms than every other subtest, its 22.1 point three-year gain is comparable to Deductive Reasoning's 30.9, but because it started from a higher 2023 base, 40.0%, which mechanically caps how large a compound growth rate can register even for a healthy, steady improvement.
The past twelve months alone show four of the five subtests losing ground. Quantitative Analysis fell by 11.1 percentage points, the largest single-year decline of any subtest in this domain, and on its own accounts for close to half of the combined movement recorded across all five subtests this year. Linguistic Cohesion fell by 5.1 points, Deductive Reasoning by 3.5, and Spatial Awareness by 2.5; only Word Categorisation improved, by a marginal 1.0 point. This concentration matters for where to focus attention: Quantitative Analysis was, until this year, one of this domain's stronger subtests, and the size of its movement relative to the other four makes it the subtest most worth re-checking specifically in next year's edition, rather than treating this year's broad, modest Verbal Reasoning decline as evenly spread across all five of its components.
The caveats already raised for this report's other drift figures apply here too: a subtest can show a strong multi-year compound growth rate and a recent single-year decline at the same time, as Deductive Reasoning, Linguistic Cohesion, and, to a lesser extent, Quantitative Analysis all do, and neither figure alone gives a complete picture. Four years of data is still a short record for separating a genuine multi-year plateau from ordinary year-to-year variation, particularly on subtests resting on a very small number of items per platform. The practical reading for this domain is to treat the three-year CAGR as a measure of how far each subtest has travelled since the panel's early, weaker generations of platforms, and the 25-26 drift as the more immediately actionable figure for this year's procurement and deployment decisions.
Rational Thinking, Subtest by Subtest
Within Rational Thinking, performance is assessed through five complementary subtests: Analogies, Artificial Language, Cause & Effect, Logical Problems, and Number Series. The 2026 results are explored from several analytical perspectives, beginning with the whole panel before moving to category-level differences, individual platform performance, and the contrast between speed versus depth tiers. The analysis subsequently shifts from the cross-sectional snapshot to the longitudinal evidence, documenting each subtest's full 2023-2026 trajectory, three-year compound annual growth rate, and this year's year-over-year drift.
All Systems Combined

A methodological note applies before the results, though it is more varied here than in the skill domains examined so far. The five Rational Thinking subtests do not all rest on the same number of items. Number Series, Cause & Effect, and Artificial Language scores across the panel fall almost entirely at 0.0%, 50.0%, or 100.0%, consistent with roughly two items each; Analogies scores are overwhelmingly 100.0%, with a single 33.3% exception, consistent with a small item count as well; Logical Problems, by contrast, shows scores across a much finer scale, in increments of roughly 12.5 percentage points, consistent with around eight items. This means Logical Problems' figures carry somewhat more precision than the other four, and a single item can move Number Series, Cause & Effect, Artificial Language, or Analogies by a large increment in a way it cannot for Logical Problems.
With that in mind, the domain splits clearly into a strong upper half and a weak, more volatile lower half. Analogies leads at 98.0%, followed by Artificial Language at 86.4% and Cause & Effect at 83.3%. Logical Problems trails at 74.6%, and Number Series is by a wide margin the weakest of the five, at just 43.9%, well below the halfway mark.
Each subtest maps onto a distinct daily task. Analogies, completing a relationship between a pair of concepts, underpins the plain-language briefings and training materials that explain an unfamiliar policy or system by comparison to something already understood; with the panel now close to solving this subtest outright, it is no longer a useful basis for comparing platforms. Artificial Language, applying invented rules consistently, is a proxy for how quickly a platform picks up an organisation's own internal jargon, coding schemes, or an unfamiliar regulatory framework; strong but imperfect panel-wide performance means onboarding to a new organisation's conventions still benefits from a verification pass. Cause & Effect, identifying the most plausible explanation for a scenario, is the mechanism behind first-line diagnostic work, an IT incident, a fraud pattern, a safety review, narrowing a wide field of possible explanations to the most credible one; solid panel-wide performance supports its use as a triage tool, not a final determination. Logical Problems, working through a puzzle governed by fixed premises, underpins rule-bound administrative decisions, scoring a tender against fixed criteria, checking a compliance checklist; measured more precisely than most of this domain's other subtests, its 74.6% panel average still falls well short of a level that would justify removing a human reviewer from the process. Number Series, predicting the next value in a numeric sequence, underpins trend-spotting in a monitoring dashboard, a budget line, a service-usage curve, a network-traffic graph; at well under half accuracy, and with a volatile history detailed later in this section, any AI-generated trend extrapolation in this domain should be treated as a rough first pass requiring independent verification, not a number to act on directly.
Skill Subset Profiles by Category
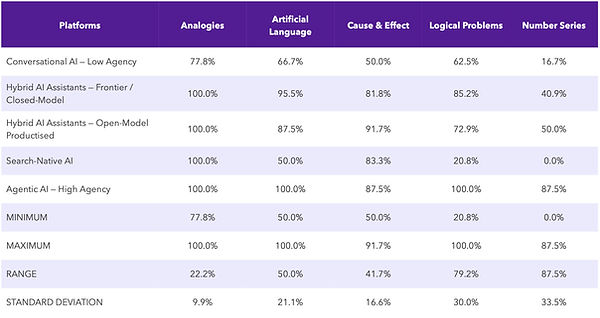
Number Series is not only this domain's weakest subtest on average, it is also the most category-dependent, an 87.5 percentage point range and a 33.5 point standard deviation, both the largest recorded among this domain's five subtests. Search-Native AI anchors the bottom: all three of its platforms score a flat 0.0% on Number Series, and the same category is also weakest on Logical Problems, 20.8%, the second most category-dependent subtest in this domain, 79.2 points of range and 30.0 of standard deviation. Search-Native AI's weakness in this domain, in other words, is concentrated in exactly the two subtests that already stood out as the most demanding and the most variable across the panel.
Agentic AI leads four of the five subtests outright and ties for the lead on the fifth, Analogies, where every category bar Conversational AI reaches a perfect 100.0%. Its own internal consistency is notable: three of its five subtests, Artificial Language, Logical Problems, and Analogies, show zero spread across all four agentic platforms. Conversational AI is the weakest category on three of the five subtests, Analogies, Cause & Effect, and, jointly with Search-Native AI, a low position on Number Series, driven almost entirely by Character AI, whose scores on Analogies, 33.3%, and Logical Problems, 0.0%, are both the lowest recorded by any platform in this category.
Conversational AI - Low Agency

Character AI is responsible for most of this category's weaker results: its 33.3% on Analogies is the only sub-100.0% score recorded for that subtest anywhere in the panel, and its 0.0% on Logical Problems sits well below Nomi's 100.0% and Replika's 87.5% on the same subtest. Number Series is this category's one point of near-uniform weakness, Nomi and Replika both at 0.0% and Character AI at 50.0%, a pattern that recurs across every category in this domain rather than being specific to low-agency systems.
Hybrid AI Assistants - Frontier / Closed-Model

ChatGPT's base tier is the only platform in this sub-panel to score 0.0% on Cause & Effect, a complete miss that its own Plus tier corrects to a perfect 100.0%, the largest single-subtest jump recorded anywhere in this sub-panel's speed-to-depth comparison. Copilot (Smart) shows the same pattern on Logical Problems, 25.0% against its own Think Deeper variant's 100.0%. Number Series is again the sub-panel's most erratic result, a 100.0 percentage point range, from 0.0% up to a perfect score, with no clear pattern separating the platforms that succeed from those that do not: Gemini 3.1 (Pro) and ChatGPT Plus both reach 100.0%, while Gemini 3.6 (Flash), ChatGPT's base tier, Copilot (Smart), and SuperGrok (Expert) all score 0.0%.
Hybrid AI Assistants - Open-Model Productised

Mistral's two variants tell opposite stories on Artificial Language: its Fast tier already manages only 50.0%, and its Think tier falls further, to 0.0%, one of the few cases in this domain where the deeper, slower tier is outright worse than the faster one. Logical Problems shows a familiar split within this sub-panel: ERNIE-Wenxin sits at 37.5% on both its variants, well below Kimi K3, Meta AI, and Qwen 3.8-Max (Thinking), all at or near 100.0%. This sub-panel's Number Series range, 100.0 percentage points, ties the Frontier tier's for the widest recorded for any subtest in any of this domain's category tables, running from a cluster of platforms at 0.0% up to Kimi K3 (High), Meta AI (Instant), and Qwen 3.8-Max (Thinking), all at a perfect 100.0%.
Search-Native AI

This sub-panel supplies the domain's clearest category-level collapse: all three platforms score 0.0% on Number Series, and the sub-panel's Logical Problems average, 20.8%, is the weakest recorded for that subtest by any category. You.com's Express and Advanced variants score identically on three of the five subtests, Analogies, Artificial Language, and Number Series, extending the now-familiar finding elsewhere in this report that this platform's deeper tier delivers little or no measurable benefit; the one exception here is Cause & Effect, where both variants already sit at a perfect 100.0%, well above Perplexity's 50.0%. For any task in this domain that depends on numerical pattern recognition or rule-based logic, this year's data gives no basis for choosing a Search-Native AI platform over the alternatives examined elsewhere in this chapter.
Agentic AI - High Agency

This is this domain's most internally consistent sub-panel by a wide margin: three of the five subtests show zero spread across all four platforms, and even on the two subtests that do differentiate, Cause & Effect and Number Series, the spread is driven by a single platform, MiniMax-M3, scoring 50.0% on both while its three peers hold a perfect 100.0%. That MiniMax-M3's shortfall appears on exactly the two subtests where this domain is weakest and most variable across the rest of the panel, rather than on the subtests where the rest of the panel is already strong, is consistent with a pattern already noted elsewhere in this report: this platform's weaker results tend to surface on the more demanding tasks, not the easier ones.
Where the Panel Actually Differs
Two findings from this subtest-level view are worth carrying into procurement and deployment decisions. Number Series is this domain's weakest and most category-dependent subtest by a clear margin, collapsing entirely in Search-Native AI and swinging widely within both the Frontier and Open-Model sub-panels; no platform or category should be trusted with a numerical-trend task in this domain without direct testing against the task at hand. Logical Problems, measured with more precision than the other four subtests, offers a more reliable signal at 74.6%, but one still well short of the accuracy needed to remove a human reviewer from a rule-based determination; the practical gap here is smaller in absolute terms than Number Series but arguably more consequential, since Logical Problems maps directly onto the kind of compliance and eligibility work already flagged as high-stakes elsewhere in this report.
Speed Versus Depth, by Subtest

Four of the five subtests improve when moving from the speed to the depth tier: Logical Problems gains 28.1 percentage points, from 59.4% to 87.5%, the largest gain in this domain; Number Series gains 24.7 points, from 29.2% to 53.8%; Cause & Effect gains 17.0 points, from 79.2% to 96.2%; and Artificial Language gains a marginal 1.0 point. Analogies, already at 100.0% on both tiers, has no room left to move. Even after the largest gain in this section, Number Series' depth-tier average, 53.8%, remains barely above chance, confirming that the deeper, slower tier narrows this domain's most serious weakness without resolving it.


Cause & Effect's aggregate gain is driven by a small number of individual moves rather than a broad shift: ChatGPT rises from 0.0% to 100.0% between its base and Plus tiers, and DeepSeek and Kimi K3 each rise by 50.0 points; the remaining nine platforms were already at 100.0% on both tiers and show no movement at all.
Number Series supplies this domain's clearest warning against assuming the deeper tier is a safe default. The platform-level detail shows six platforms gaining, three of them by a full 50 or 100 percentage points, but three platforms losing ground: DeepSeek falls from 50.0% to 0.0%, Grok's deeper tier, branded SuperGrok, falls from 50.0% to 0.0%, and Meta AI falls from a perfect 100.0% on its Instant tier to 50.0% on its Thinking tier. You.com's two variants remain tied at 0.0%, extending this platform's established pattern of showing no benefit from its deeper tier to this subtest as well. In practical terms, a buyer selecting the deeper tier specifically to improve numerical-trend performance has, on this year's evidence, roughly even odds of making that specific capability worse rather than better, depending on the platform chosen; this is the most unpredictable result recorded anywhere in this domain's speed-versus-depth data and the clearest case in this chapter for testing both tiers directly rather than assuming the pricier one is the safer choice.
AI Drift, 2023-2026

Rational Thinking's four-year trajectory shows three broadly positive paths and one genuinely erratic one. Analogies climbed steadily and modestly throughout, from 90.0% in 2023 to 98.0% in 2026, already close to its ceiling from the outset. Artificial Language jumped sharply in its first year, from 30.0% to 78.6%, then continued climbing more gradually to 86.4%. Cause & Effect rose steadily in every year measured, from 50.0% to 83.3%, the most consistently upward path of any subtest in this domain. Logical Problems climbed from 20.0% in 2023 to a peak of 88.9% in 2025, before falling back to 74.6% this year, a genuine reversal after three years of strong growth. Number Series is this domain's clear outlier: from 30.0% in 2023 it fell to 7.1% in 2024, rose sharply to 61.1% in 2025, and fell again to 43.9% in 2026, the only subtest in this domain with two declines across its four-year record rather than one, and by a wide margin the most volatile trajectory of the five.
The three-year compound annual growth rate needs particular care in this domain, since two of its subtests illustrate, in different ways, why a high compound growth rate should not be read as a measure of current strength on its own. Logical Problems posts the highest CAGR of the five, 55.1%, driven by its very low 2023 starting point, 20.0%, but this is also the subtest that has just fallen 14.3 points from its 2025 peak; the compound growth rate describes a strong multi-year climb that has, in the most recent year, begun to reverse. Artificial Language posts the second-highest CAGR, 42.3%, but unlike Logical Problems it has not reversed, continuing to add ground in every year measured, so its high growth rate and its current strength point in the same direction. Number Series' CAGR, 13.6%, is comparatively unremarkable despite the subtest's dramatic swings, because compounding a large early fall against a large subsequent rise and a further fall produces a modest net figure that conceals rather than reveals the volatility sitting underneath it; this is a case where the CAGR is the least informative number in the whole table, and the year-by-year figures matter far more than the compound summary. Analogies, already close to its ceiling in 2023, posts the lowest CAGR, 2.9%, for the same structural reason already noted elsewhere in this report: a high starting base mechanically compresses how large a compound growth rate can register, whatever the subtest's underlying trajectory.
The past twelve months show four of the five subtests still improving, Cause & Effect by 5.6 points, Analogies by 3.5, Artificial Language by 3.0, and two in decline, Number Series by 17.2 points and Logical Problems by 14.3. Together these two account for close to three-quarters of the combined movement recorded across all five subtests this year, comfortably the largest contributors, and both are subtests already identified in this section as this domain's weakest or most erratic. This concentration is useful for where to focus attention going forward: Rational Thinking's modest domain-level decline, already reported elsewhere in this analysis, is not evenly spread across its five components, it is driven overwhelmingly by two of them, and those two are the ones most worth re-checking closely in next year's edition.
The caveats already raised for this report's other drift figures apply here in full: four years of data remains a short record for separating a genuine trend from ordinary year-to-year variation, and this is particularly true for Number Series, whose four-year path has already reversed direction twice and whose underlying item count appears small enough that a handful of different answers could shift the yearly figure substantially. The practical reading for this domain is to treat Logical Problems' recent decline as a genuine signal worth monitoring, since it follows three years of consistent growth and maps onto high-stakes work, and to treat Number Series' year-to-year figures with structurally more caution than any other subtest in this domain, given how sharply and repeatedly it has moved in both directions within a single four-year window.
Numerical Ability, Subtest by Subtest
The Numerical Ability score brings together five areas of performance: Temporal Mathematics, Order & Fraction Mathematics, Spatial Reasoning, Statistical Reasoning, and Time-Related Calculations. To identify where numerical strengths and weaknesses actually reside, this section moves beyond the aggregate domain score and examines the 2026 evidence at subtest level. Comparisons are made across the whole panel, between categories, platform by platform, and across speed versus depth tiers. Each subtest is then tracked over the full 2023-2026 period, with its three-year compound annual growth rate and this year's year-over-year drift providing complementary measures of longer-term progression and recent movement.
All Systems Combined

The five subtests in this domain differ in how finely their scores can move, though the percentages themselves remain directly comparable across subtests. Order & Fraction Mathematics, Spatial Reasoning, Statistical Reasoning, and Time-Related Calculations scores fall almost entirely at 0.0%, 50.0%, or 100.0%, consistent with roughly two items each; Temporal Mathematics scores also include a 33.3% and 66.7% band, consistent with around three items. This means a single incorrect or correct answer can shift a platform's score on these particular subtests by a much larger increment than it would on a more finely graded test, worth bearing in mind whenever a single-platform result looks unusually extreme in the tables that follow.
Statistical Reasoning leads the domain at 92.4%, well ahead of Spatial Reasoning at 80.3% and Temporal Mathematics at 77.8%. Time-Related Calculations sits at 56.1%, and Order & Fraction Mathematics is the weakest of the five, at 40.9%, the only subtest in this domain that the panel gets wrong more often than right.
Each subtest maps onto a distinct daily task. Temporal Mathematics, age- and date-based arithmetic, underpins pension-age calculations, benefit-eligibility windows, and licence-renewal deadlines; solid but imperfect performance still warrants a spot check on high-volume, low-error-tolerance eligibility work. Order & Fraction Mathematics, exact multi-step calculation, underpins invoicing, tax computation, and procurement cost breakdowns, work where there is only one correct answer and every downstream figure inherits any early mistake; at well under half accuracy, this is the domain's clearest case for mandatory independent verification of any AI-generated calculation before it is used in a financial or engineering context. Spatial Reasoning, distances, angles, and physical layouts expressed in text, underpins early-stage engineering feasibility screening and logistics or construction planning documents; solid performance supports its use as a triage tool ahead of specialist review, not as a substitute for it. Statistical Reasoning, interpreting a dataset and reaching a probability-based conclusion, underpins public-health and economic reporting, evidence-based policy work, and quality-assurance sampling; this is the domain's strongest and most dependable result. Time-Related Calculations, arithmetic involving time zones, durations, and dates, underpins cross-border meeting scheduling and service-level-agreement deadline tracking; it has, as the drift analysis later in this section shows, been this domain's weakest capability by a wide margin for most of this study's history and remains, despite a sharp recent improvement, the subtest most worth re-testing before it is trusted with anything carrying a real contractual or scheduling consequence.
Skill Subset Profiles by Category

Time-Related Calculations is both the weakest and the most category-dependent subtest at this level, an 87.5 percentage point range and a 36.5 point standard deviation, both the largest recorded among this domain's five subtests. Search-Native AI anchors the bottom at a flat 0.0%, and the same category is also weakest on Order & Fraction Mathematics, 0.0%, and Temporal Mathematics, 33.3%, the lowest category score on three of the five subtests in this domain. Statistical Reasoning is the one subtest where Search-Native AI is not the weakest category: three categories, Frontier/Closed-Model, Open-Model Productised, and Agentic AI, all reach a perfect 100.0% with zero internal spread, Search-Native AI sits in between at 66.7%, and Conversational AI posts this subtest's lowest category score, 50.0%, driven by Character AI's 0.0%, discussed below. Search-Native AI's usual position as this domain's weakest category, in other words, does not hold on every subtest.
Agentic AI leads four of the five subtests outright, with zero spread on three of them, Temporal Mathematics, Spatial Reasoning, and Statistical Reasoning. Conversational AI is the weakest category on Order & Fraction Mathematics and Time-Related Calculations, and its Statistical Reasoning score, 50.0%, is in fact the lowest of any category on that subtest, even lower than Search-Native AI's 66.7%, a reminder that this category's occasional strong subtest results elsewhere in this report do not extend reliably into numerical work.
Conversational AI - Low Agency
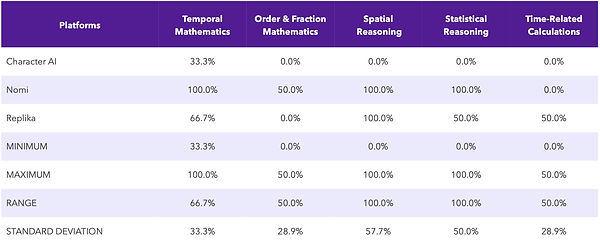
Character AI accounts for most of this category's weakness: it scores 0.0% on four of the five subtests, Order & Fraction Mathematics, Spatial Reasoning, Statistical Reasoning, and Time-Related Calculations, and only 33.3% on Temporal Mathematics. Nomi and Replika both perform far better on Spatial Reasoning, 100.0% each, but neither exceeds 50.0% on Time-Related Calculations, and Nomi scores 0.0% on that subtest despite reaching a perfect score on three of the other four, underlining that this specific weakness cuts across otherwise strong platforms in this category rather than tracking overall competence.
Hybrid AI Assistants - Frontier / Closed-Model

This sub-panel's Order & Fraction Mathematics results include this domain's clearest case of a depth tier underperforming its own speed tier: ChatGPT's base model scores a perfect 100.0%, while ChatGPT Plus falls to 50.0% on the same subtest, the largest single-subtest regression recorded anywhere in this sub-panel's speed-to-depth comparison. Gemini 3.6 (Flash) is the only platform in this sub-panel to score 0.0% on Temporal Mathematics, corrected by its own Deep Think variant to a perfect 100.0%. Time-Related Calculations shows this sub-panel's widest spread, a full 100.0 percentage point range, from ChatGPT's base tier and Copilot (Smart) at 0.0% up to seven platforms at a perfect 100.0%.
Hybrid AI Assistants - Open-Model Productised

Statistical Reasoning is this sub-panel's one point of complete uniformity, all twelve platforms at a perfect 100.0%, zero spread. ERNIE-Wenxin 5.1 is this sub-panel's most consistently weaker platform on this domain, scoring the same 66.7% on Temporal Mathematics and 50.0% on Spatial Reasoning across both its variants, with no change between its standard and Think Deeper modes on any of the five subtests, one of the flattest speed-to-depth profiles recorded in this domain. Time-Related Calculations again supplies this sub-panel's widest range, 100.0 percentage points, from a cluster of platforms at 0.0% up to six platforms at a perfect 100.0%.
Search-Native AI

This sub-panel is weak on four of the five subtests, but not uniformly so: Statistical Reasoning is the exception, where Perplexity's 0.0% sits in sharp contrast to both You.com variants at a perfect 100.0%, a single-platform failure rather than a category-wide one. Elsewhere the pattern is closer to uniform: all three platforms score exactly 33.3% on Temporal Mathematics, exactly 50.0% on Spatial Reasoning, and exactly 0.0% on both Order & Fraction Mathematics and Time-Related Calculations, with You.com's Express and Advanced variants identical on every one of the five subtests, extending the now-familiar finding elsewhere in this report that this platform's deeper tier delivers no measurable benefit. For any task in this domain beyond the kind of dataset interpretation that Statistical Reasoning represents, this year's data gives no basis for choosing a Search-Native AI platform over the alternatives examined elsewhere in this chapter.
Agentic AI - High Agency

This is this domain's most internally consistent sub-panel: three of the five subtests, Temporal Mathematics, Spatial Reasoning, and Statistical Reasoning, show zero spread across all four platforms, every one at a perfect 100.0%, and Order & Fraction Mathematics is uniform as well, all four at 50.0%. The only subtest with any spread is Time-Related Calculations, where MiniMax-M3 sits at 50.0% against a perfect 100.0% for its three peers, the same platform already identified elsewhere in this report as this category's weaker performer, and again on one of this domain's more demanding subtests rather than one of its easier ones.
Where the Panel Actually Differs
Two findings from this subtest-level view are worth carrying into procurement and deployment decisions. Order & Fraction Mathematics is this domain's weakest subtest in absolute terms and shows no single category or platform pattern that reliably predicts strong performance, which argues for direct, task-specific verification of any AI-assisted calculation work rather than trusting a platform's category or composite reputation. Time-Related Calculations is the more category-dependent of the two weak subtests, collapsing entirely in Search-Native AI while several Frontier and Open-Model platforms already reach a perfect score, which means the right platform choice for cross-border scheduling or deadline-tracking work varies far more by specific platform than it does for most of this domain's other subtests.
Speed Versus Depth, by Subtest

Three of the five subtests improve substantially when moving from the speed to the depth tier: Time-Related Calculations gains 39.4 percentage points, from 37.5% to 76.9%, the largest gain in this domain; Temporal Mathematics gains 31.2 points, from 61.1% to 92.3%; and Spatial Reasoning gains 25.6 points, from 66.7% to 92.3%. Order & Fraction Mathematics gains only 4.5 points, from 41.7% to 46.2%, and Statistical Reasoning, already at a perfect 100.0% on both tiers, has no room left to move.


Order & Fraction Mathematics' modest aggregate gain conceals a genuine regression rather than a uniformly weak improvement. ChatGPT falls from a perfect 100.0% on its base tier to 50.0% on its Plus tier, this domain's clearest case of a platform's own deeper mode underperforming its faster one on this specific subtest; against that, Gemini gains 50.0 points moving from Flash to Deep Think, and the remaining ten platforms show no movement at all, already matched between their two tiers. The net 4.5 point gain reported at the aggregate level is therefore not a small improvement spread across the sub-panel, it is one large loss and one large gain very nearly cancelling out, with most platforms unmoved either way.
Time-Related Calculations shows the clearest overall case for the deeper tier in this domain, with five platforms gaining 50 to 100 percentage points, but it is not without exception: Claude falls from a perfect 100.0% on its Haiku 4.5 speed tier to 50.0% on its Sonnet 5 depth tier, consistent with a pattern already noted elsewhere in this report that Claude's deeper tier does not uniformly outperform its faster one across every subtest, and You.com's two variants remain tied at 0.0%, extending this platform's established pattern to this subtest as well.
AI Drift, 2023-2026

One figure in this table needs a direct caveat before the rest of the analysis, because presenting it without qualification would be misleading. Time-Related Calculations scored 0.0% in both 2023 and 2024, which makes a standard three-year compound annual growth rate mathematically undefined, division by a starting value of zero has no defined result. The 404.5% figure in the table is best understood as the simple growth rate from 2025, the first year this subtest recorded any accuracy at all, 11.1%, to this year's 56.1%, rather than a genuine three-year compound rate comparable to the other four subtests in this table. It should not be read alongside Order & Fraction Mathematics' 26.9% or Spatial Reasoning's 26.2% as if all four described the same kind of growth; those three summarise a genuine multi-year climb, while Time-Related Calculations' figure describes a single year's jump from a near-zero base. The underlying trajectory, 0.0% in 2023, 0.0% in 2024, 11.1% in 2025, and 56.1% this year, is the more informative and more honestly comparable way to read this subtest's progress.
Set against that trajectory, this year's 44.9 point gain in Time-Related Calculations is genuinely the standout movement in this domain, and it goes a long way toward explaining why the panel spent its first two years of measurement effectively unable to perform this kind of calculation at all before beginning to close the gap in 2025 and 2026. The other four subtests show a more familiar shape: Temporal Mathematics, Order & Fraction Mathematics, Spatial Reasoning, and Statistical Reasoning all grew steadily from 2023 through a 2025 peak, then declined this year, by 16.7, 3.5, 14.1, and 2.0 points respectively. This is the same broad pattern already reported for Rational Thinking's subtests elsewhere in this report: several years of growth followed by a single year of reversal, with the size of that reversal varying considerably across subtests.
The three-year compound annual growth rate for the three subtests where it is genuinely comparable, Order & Fraction Mathematics at 26.9%, Spatial Reasoning at 26.2%, and Statistical Reasoning at 15.5%, tracks reasonably closely with each subtest's absolute trajectory, none of these three shows the kind of sharp disconnect between compound growth and current standing seen elsewhere in this report's subtest-level analysis. Temporal Mathematics, at 15.9%, sits in the same range despite this year's 16.7 point decline, since its 2023 base, 50.0%, was comparatively high enough that even a reversed final year still leaves a respectable multi-year growth figure.
The past twelve months show a domain that improved overall, largely on the strength of a single subtest. Time-Related Calculations' 45.0 point gain accounts for more than half of the combined movement recorded across all five subtests this year, comfortably the largest contributor and the only one moving in the positive direction; Temporal Mathematics, Spatial Reasoning, Order & Fraction Mathematics, and Statistical Reasoning all declined. This is a different shape from the composite-level improvement it helps produce: Numerical Ability's overall 2.5 point gain this year, reported elsewhere in this analysis, is not a case of broad, even progress, it is one subtest's rapid emergence from a near-total absence of capability outweighing genuine, if modest, declines in the other four.
The caveats already raised for this report's other drift figures apply here in full, with particular force for Time-Related Calculations given both its small apparent item count and the mathematical limits of applying a standard compound growth rate to a metric that started at zero. Four years of data remains a short record for separating a genuine trend from ordinary year-to-year variation, and this is exactly the kind of subtest, newly emerging from a low base, where next year's reading will matter more than usual for establishing whether 2026's gain marks the start of a sustained capability or a single strong year that does not repeat.
Conclusion
A technology that is levelling off in aggregate, while becoming steadily more autonomous, is not a technology that has become safer. It is one whose remaining errors matter more, because fewer humans are positioned to catch them before they act.
Four years of monthly, unbroken measurement converge on two facts that together define this report. First, the four-year climb in AI accuracy - 35.0 percentage points since 2023 - has all but stalled this year, gaining just 1.7 points, the sharpest deceleration this study has recorded. Second, the scope of what is being measured has itself shifted toward greater autonomy: earlier editions of this study concentrated on conversational systems built to hold a dialogue, and this year's panel is the first to add a dedicated high-agency tier - four fully autonomous agents capable of planning and executing multi-step work with little or no human review at each step. Read separately, either fact is manageable. Read together, they describe an organisational risk that most adoption plans are not yet built to manage: systems are being trusted with more independent action at precisely the moment their improvement can no longer be assumed.
Fluency Is Not Accuracy - and Confidence Is Not Correctness
This year supplies direct evidence of why that distinction matters operationally, not just academically. Search-Native AI produces some of the most fluent language in the entire panel (71.6%) while posting the weakest reasoning scores of any category (30.3% on Numerical Ability, 43.1% on Rational Thinking) - a platform can sound entirely credible while reasoning very poorly, and a reader has no reliable way to tell the difference from the tone of the answer alone. Verbal Reasoning and Rational Thinking, the two skills this report ties most directly to eligibility checks, compliance determinations, and first-line diagnostic judgement, both declined in 2026 for the first time in this study's history. Neither fact, on its own, is proof of a reversal. Together, they are proof that a platform's past reliability is not a guarantee of its current reliability, and that the assumption baked into most procurement cycles - test once, deploy, and trust - no longer matches how this technology actually behaves.
The Imperative: Build the Test, Don't Just Buy the Tool
The single most consequential, practical recommendation in this report follows directly from its own method. This study has value precisely because it tests the same fixed battery, every month, across every platform, regardless of vendor claims or version numbers. Organisations now need to run a version of that same discipline internally, as a standing risk-management protocol rather than a one-time procurement gate. Concretely, that means four things every public and private organisation deploying AI in 2026 should be able to answer, in writing, about every system it relies on:
-
What was it tested against? A task-specific battery built from the organisation's own real work - its correspondence, its eligibility rules, its calculations, its case files - not a vendor's marketing benchmark or a generic leaderboard score.
-
Which configuration was tested? Speed and depth tiers must be evaluated separately; this year's data shows a 12.7-point average gap between them, and a third of platforms that show no gap at all. A test of one tells you nothing about the other.
-
How recently was it tested? AI drift is real and often invisible in headline scores: a platform can hold a steady composite result while quietly picking up new reasoning quirks or biases underneath it. A test performed at launch has an expiry date, and this year's first-ever declines in two of four skill domains are the clearest evidence yet that the expiry date arrives sooner than most deployment plans assume.
-
What happens when it acts autonomously? For any agentic or high-agency system, cognitive testing of the kind this report performs is necessary but not sufficient. A strong reasoning score is not evidence that a system will plan, sequence, and execute a real task correctly and safely. Execution-level testing - with audit trails, human checkpoints, and a rollback path - is not optional for any workflow with financial, legal, or safety consequences.
None of this argues against adoption. The opposite is true: this year's plateau is, on balance, good news for anyone ready to commit, because the platforms available today are a more durable basis for planning than at any earlier point in this study. But committing to a platform and committing to test it are not the same decision, and this report's four-year record makes the case for both, together, as plainly as the data allows: the organisations that build a recurring testing protocol into how they manage AI risk - the way they already manage financial risk, legal risk, and operational risk - will be the ones able to move fastest and most safely on the frontier this report has spent four years mapping. Those that don't will be the ones who discover, in an audit, a wrongful payment, or a missed deadline, exactly why fluency was never the same thing as accuracy.
About the Author
Jean Jacques André
CEO, WorkN'Play | Board Director, MauBank Holdings Ltd & MauFactoring Ltd
Jean Jacques André is a Franco-Mauritian entrepreneur, board director, consultant and corporate trainer specialising in strategic management and the application of Artificial Intelligence to business. Born in Mauritius in 1971, he brings more than thirty years of experience spanning business, finance, higher education and technological innovation.
A graduate of the London School of Economics and Political Science (LSE), he has also pursued executive and professional education at Peking University, Harvard Business School and the Stanford Institute for Human-Centered Artificial Intelligence (Stanford HAI). In 2026, he earned Stanford's certificate for Generative AI: Technology, Business, and Society, a programme exploring the foundations of Generative AI, its business applications and its implications for organisations and society.
In 2010, Jean Jacques founded WorkN'Play in France, an EdTech company specialising in web-based Data-Intensive Apps for the education and training of business leaders, managers and university students. Its solutions combine economic intelligence, strategic diagnosis, data analytics and corporate intelligence, turning complex datasets into learning, analytical and decision-support tools.
Through WorkN'Play and his consulting and training activities, Jean Jacques has worked with corporations and academic institutions across Europe, Africa and the Middle East, including Procter & Gamble, Sofitel Hotels & Resorts, HEC Paris, ESSEC Business School, Sciences Po Paris, Samsung Campus, the University of Mons (Belgium), POLIS University (Albania), École Supérieure des Affaires (Lebanon) and MCCI Business School in Mauritius.
He also holds corporate governance responsibilities within the Mauritian financial sector as a Board Director of MauBank Holdings Ltd and MauFactoring Ltd. At MauBank Holdings, he contributes to the governance and strategic oversight of a diversified financial group encompassing commercial banking, investment banking and factoring activities. This role provides him with a broad perspective on corporate strategy, business finance, governance, innovation and digital transformation.
Teaching has been another central feature of his career. Jean Jacques has delivered courses and programmes at business schools and universities across Europe, Africa and the Middle East, using a pedagogical approach built largely around case studies, real-world data and the resolution of complex strategic challenges. His current work focuses particularly on the impact of Large Language Models and agentic AI systems on decision-making, management practices and business models. His research includes comparative assessments of AI platforms, their reasoning capabilities, performance and professional applications.
As part of an earlier collaboration with MCCI Business School, he contributed to the coordination of the executive programme Business Opportunities and Applications of Generative AI, based on a Stanford-developed curriculum for executives and business leaders. In 2026, he continues this work through "AI for Business & Social Impact", a programme delivered in collaboration with FRCI, a Microsoft technology expert in Mauritius. The course adopts a strongly practical approach, allowing participants to experiment with different AI models and agents, address real-world business challenges and examine their strategic, organisational, economic, ethical and societal implications.
Earlier in his career, Jean Jacques held positions across consulting, marketing, human resources and corporate planning. His experience includes marketing consulting at DCDM, planning responsibilities in the Mauritian textile industry and a human resources role at Ireland Blyth Ltd. In France, he founded Hygides Santé, a management consultancy specialising in the hospitality and food-service sectors, before taking on senior marketing and business development responsibilities, including at the Institut de Médecine Environnementale.
His main professional and research interests now lie at the intersection of Artificial Intelligence, Corporate Strategy, Sustainable Development, the Social and Solidarity Economy, International Business & Politics, Marketing and Sales Management.
Across his roles as a board director, entrepreneur, lecturer and corporate trainer, Jean Jacques is guided by a common principle: emerging technologies create sustainable value when they contribute to a deeper understanding of organisations, better-informed decisions and positive economic, environmental, and social impact.